Tracking Vital Signs
 Monitoring the health of our creeks and streams tells us how the Clark Fork basin is faring, and how our projects are performing. Our restoration and water leasing projects span hundreds of miles across the basin–we are committed to ensuring these projects are effective for improving habitat and water quality.
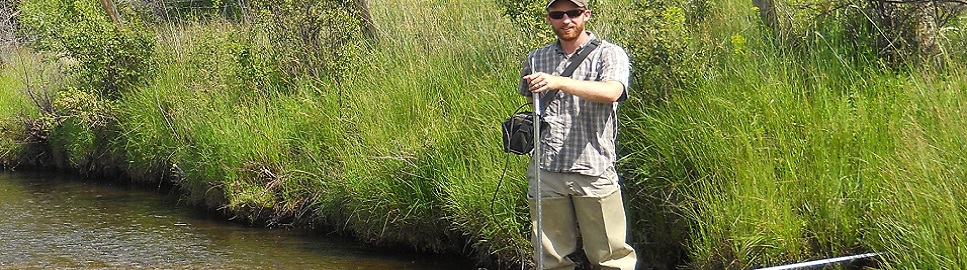
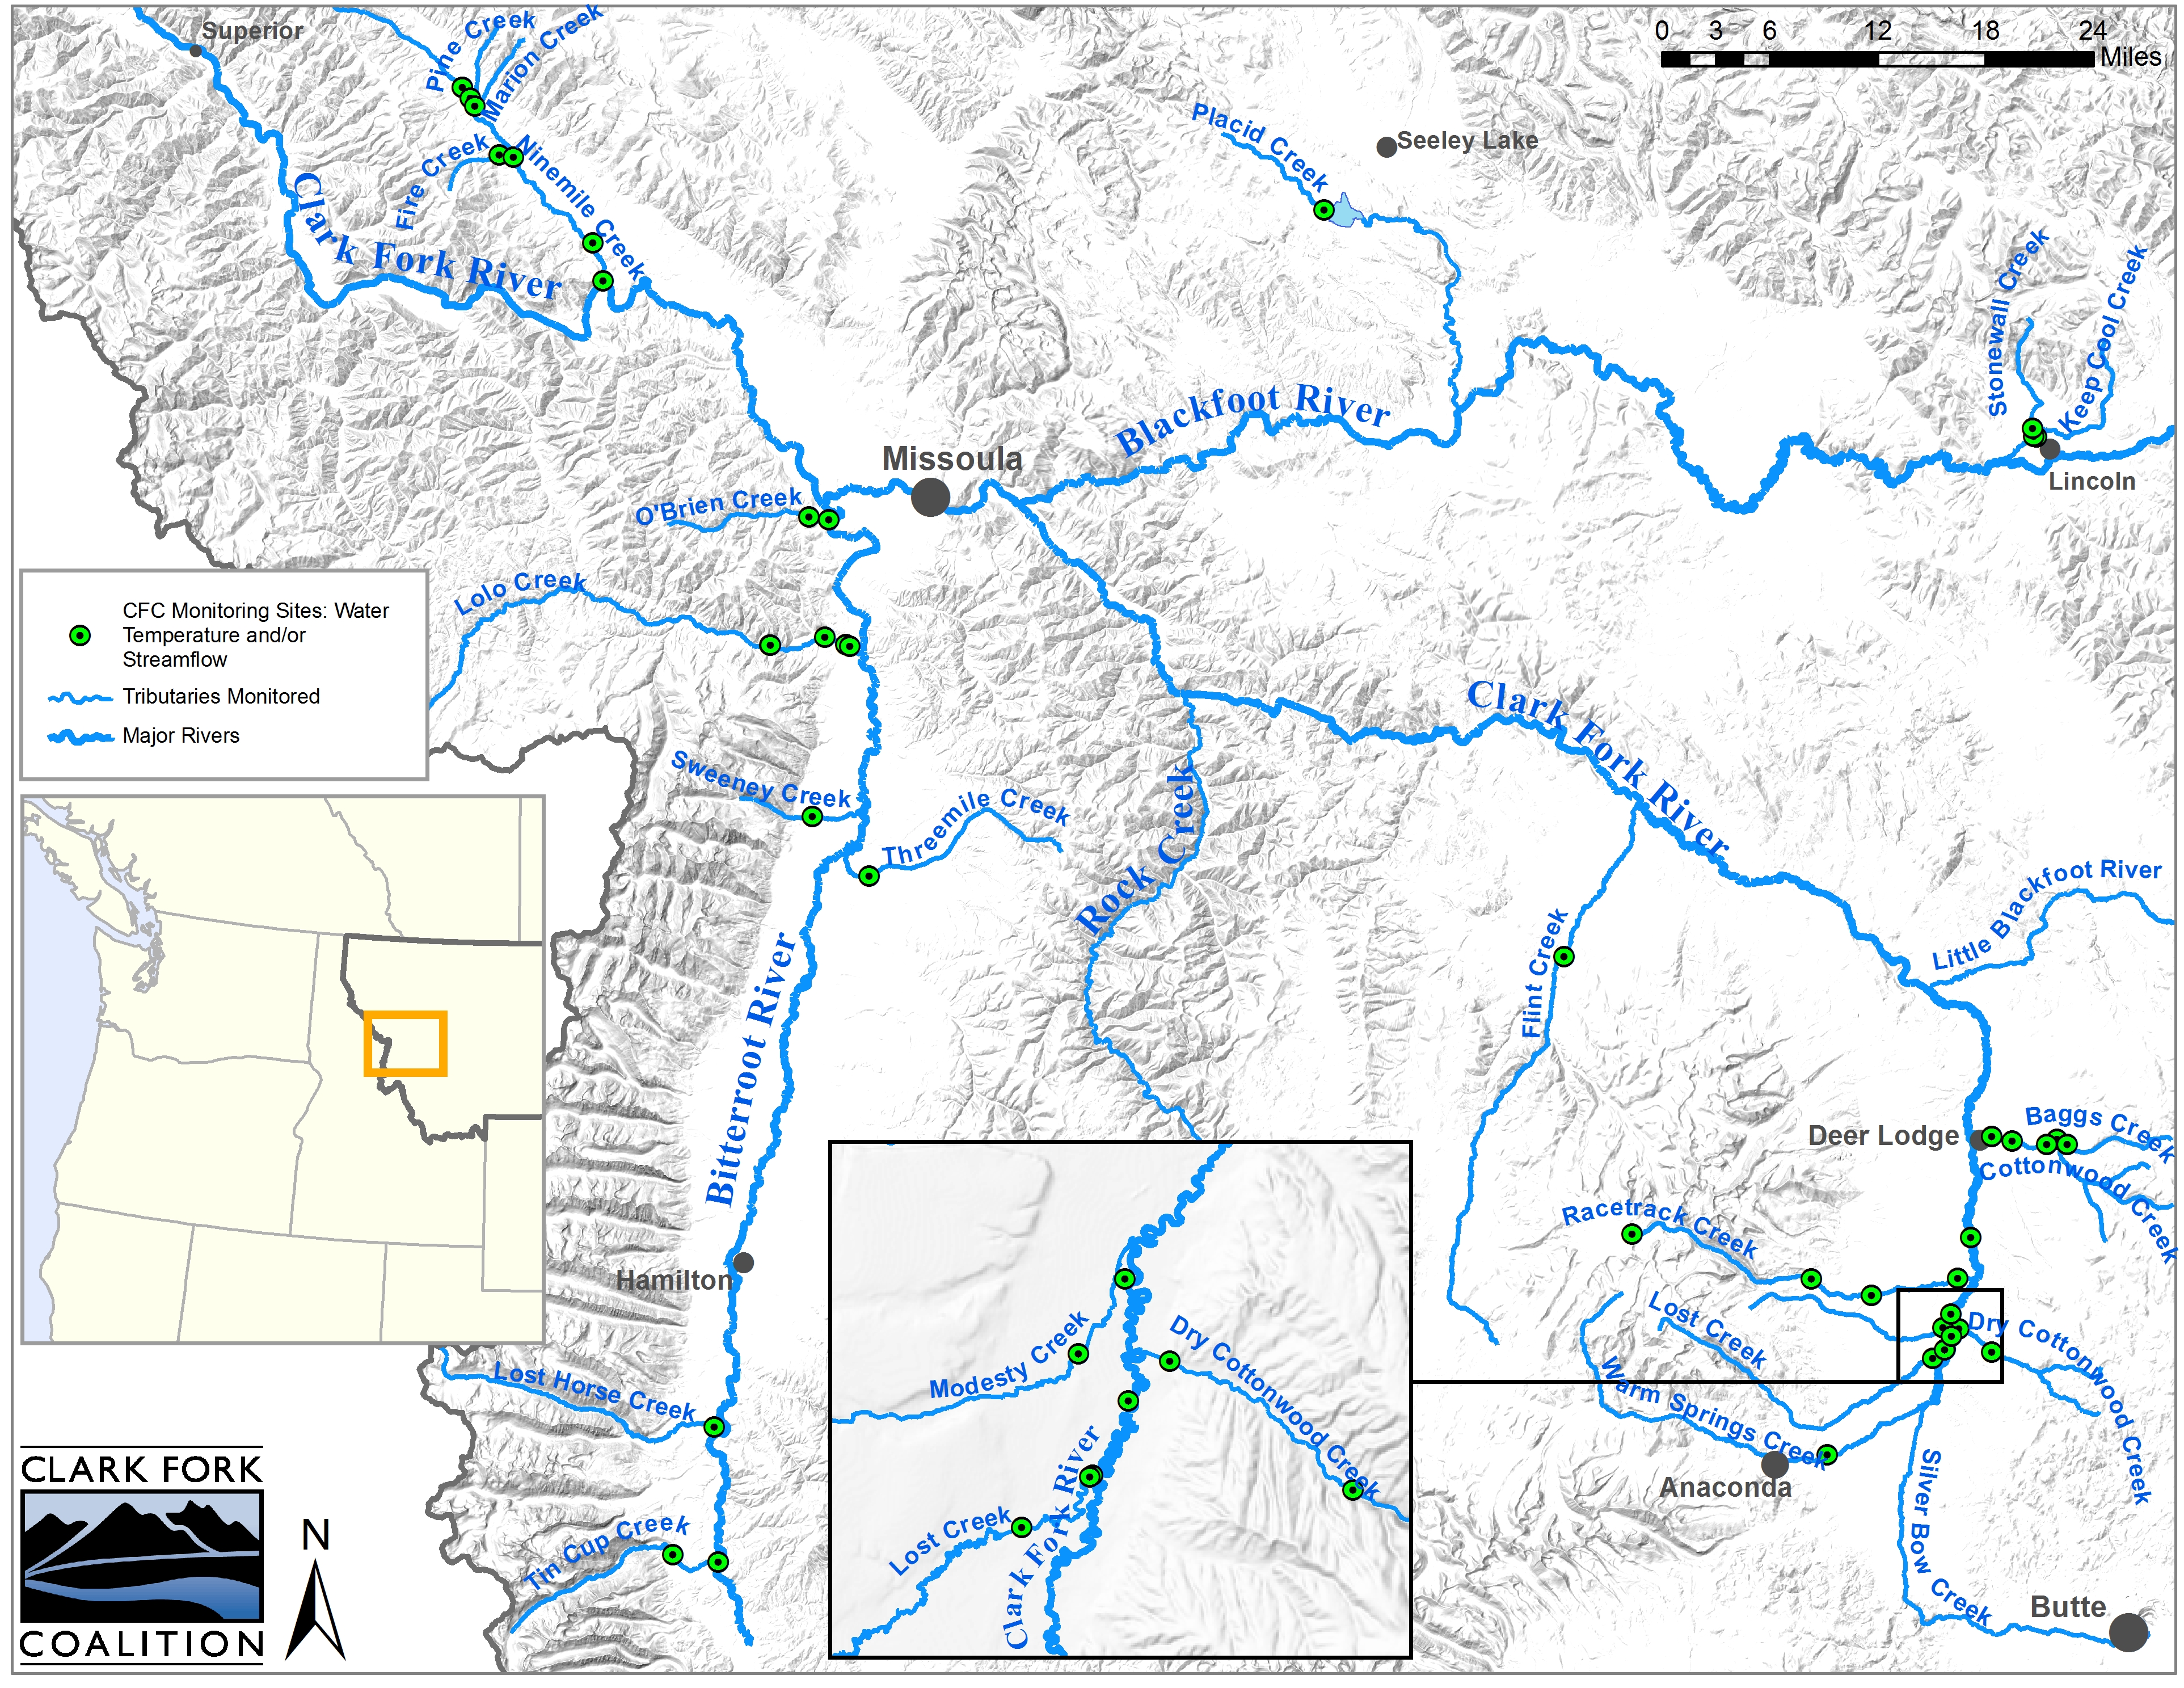
We currently record streamflow and temperature at 42 monitoring stations twice-monthly from May through October. This entails photo documentation as well as recording flow, temperature and water depth. We also manage telemetry stations in the Bitterroot and Upper Clark Fork that allow us to gather real-time flow data and intervene before flows get critically low. The data we collect helps us manage instream water rights, and informs the public on the health of our tributaries.
Lolo National Forest Stream Temperature Monitoring
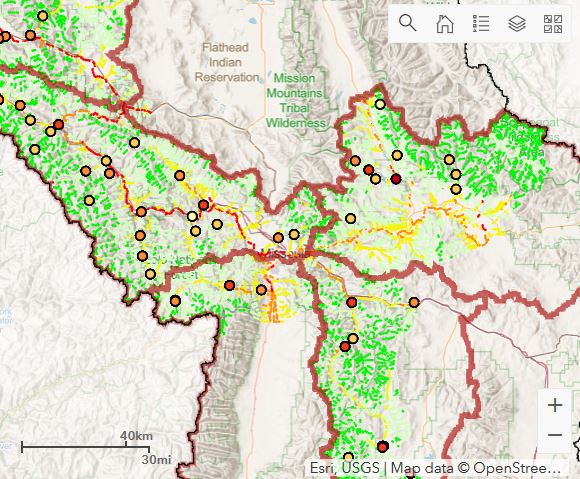 We have partnered with Lolo National Forest (LNF) and Blue Water GIS since 2011 to provide stream temperature data for the Forest to help them understand and address climate change, management issues, water quality, and fish population questions over time. The monitoring network includes 76 sensors at designated locations, which have been monitored annually since 2012.
Check out this fascinating interactive story map to see monthly temperature data by stream (includes tributaries in the Bitterroot, Blackfoot, Flint/Rock, Lower Clark Fork, and Middle Clark Fork subbasins), explore long-term trends, read about future research goals, and much more.
Curious about other data that illustrates the state of water in the Clark Fork watershed?
USGS Stream gages display the current hydrographs at USGS gate sites in the Upper Clark Fork. The Deer Lodge gage is particularly interesting because it includes real time turbidity levels (which describes the amount of suspended sediment in the water column).
- Clark Fork above Missoula
- Clark Fork at Turah Bridge
- Clark Fork near Drummond
- Clark Fork above the Little Blackfoot
- Clark Fork at Deer Lodge
- Clark Fork near Galen
- All Montana stream gages
NRCS SNOTEL snowpack update report site allows you to custom build a snowpack report that details the current state of the snowpack (as a percent of the “normal” 1980-2010 average). If you choose a report for Montana it will show snowpack/precipitation data for the major watersheds in the state.
Climate Prediction Center temperature & precipitation outlooks show the most up to date long range (6+ days out) temperature and precipitation forecasts. The CPC updates the 6 and 10 day forecasts daily with the one month forecasts updated every 2 weeks.
Donate to help us monitor stream health.