

Bitterroot Mainstem Long-Term Trends Monitoring
Prepared by: Clark Fork Coalition, P.O. Box 7593, Missoula, MT 59807
Introduction
This report presents 2025 nutrient and benthic algae monitoring results from the Bitterroot River Long-Term Trends Monitoring Project (BTMP) collected by the Bitterroot River Protection Association (BRPA) and the Clark Fork Coalition (CFC), under guidance from the Montana Department of Environmental Quality (DEQ). This report also summarizes and presents results of quality assurance and quality control analysis by DEQ. The purpose of the report is to present monitoring results and assess compliance with water quality standards.
The mainstem of the Bitterroot River begins at the confluence of the East and West Forks of the Bitterroot at the south end of the Bitterroot Valley and ends at its confluence with the Clark Fork River near Missoula. It flows for approximately 83 miles through Ravalli and Missoula Counties, and drains a 2,855 square mile watershed. Streamside communities include Missoula, Lolo, Florence, Corvallis, Woodside, Hamilton, Grantsdale, Darby, and Conner.
DEQ completed Total Maximum Daily Loads (TMDLs) for this watershed beginning with the 2003 Upper Lolo Creek TMDLs. The Bitterroot Headwaters TMDLs (the West and East Forks of the Bitterroot River) were completed in 2005. In 2011, DEQ completed the Bitterroot Temperature and Tributary Sediment TDMLs and in 2014 completed the remaining Bitterroot Watershed TMDLs.
In 2019, the Bitterroot watershed became the Water Quality Division’s Nonpoint Source Program priority watershed for a 2-3 year timeframe (DEQ 2019a). More detail about concurrent water quality improvement activities and objectives can be found within the Pilot Level I Priority: Bitterroot Watershed Protect Plan (DEQ 2019b). A major focus of the priority project includes tracking nutrient trends on the mainstem Bitterroot River, which led to the creation of the BTMP.
The sampling design and primary objective of this monitoring effort is to detect long-term trends in nutrient and benthic algae chlorophyll concentrations in the Bitterroot River. Additional details on the project’s objectives can be found in the Sampling and Analysis Plan (MDEQ 2025).
The objectives are met by:
- Summer monitoring: The BRPA collected nutrient samples, TSS, and field constituents in summer at six sites on the Bitterroot River on eight sampling occasions – twice monthly, July through October.
- Benthic algae monitoring: CFC collected summer benthic algae samples for chlorophyll-a and ash-free dry weight at six sites on the Bitterroot River on two sampling occasions, once in early August and once in early September.
Specifically, the BTMP measures:
- Nutrients: total phosphorus as P (TP), soluble reactive phosphorus as P (SRP) from filtered samples, total persulfate nitrogen as N (TN), nitrate + nitrite as N (N+ N), and total ammonia as N.
- Total Suspended Solids (TSS)
- Field parameters: water temperature (˚C), dissolved oxygen (mg/L), pH (standard units), redox potential (mv), specific conductance (μs/cm), total dissolved solids (mg/L), and turbidity (NTU).
- Benthic algae: chlorophyll-a (mg/m2) and ash-free dry weight (g/m2).
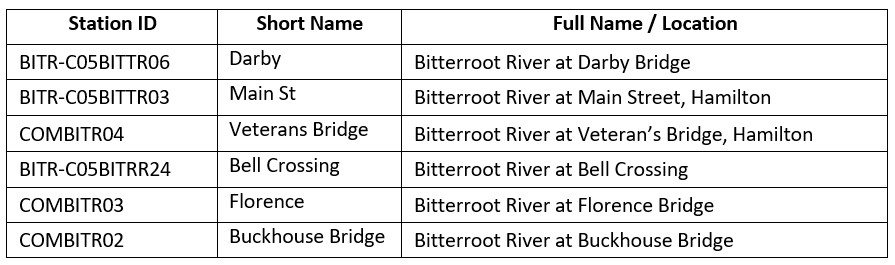
All nutrient samples were analyzed by Energy Laboratory in Helena, MT, and benthic algae samples are analyzed by the University of Montana’s Watershed Health Clinic. Sampling, QA/QC and analytical methods are described in the QAPP (MDEQ, 2025). The QA/QC Report for 2025 Bitterroot Mainstem Long-Term Nutrient Trends Monitoring is attached to this report. Monitoring station locations are provided in Table 1. Rationale for sampling locations is explained in more detail in the QAPP (MDEQ 2025).

Data QA/QC Summary
All results are given as the concentration of N or P within the sample, not the concentration of the compound. For example, N+N results indicate the sum of NO3-N and NO2-N. Full results for this project including measured field parameters, sample duplicates, and blanks, are included as an attachment to this document and are also available through the federal Water Quality Portal at https://www.waterqualitydata.us/. Attachments and results are also available on the Clark Fork Coalition website at https://clarkfork.org/long-term-monitoring/.
Field science is messy, and it is necessary to have rigorous procedures in place to ensure data quality.
All laboratory and field data were reviewed and validated per guidance in the SAP (MDEQ, 2025). Montana DEQ analyzes and flags the monitoring data each year for quality assurance/quality control and provides the QA/QC Report for 2025 Bitterroot Mainstem Long-Term Nutrient Trends Monitoring that is attached to this report. This section briefly summarizes the results. Data flags from the QA/QC report are included in the 2025 BTMP Data Tables.
Of the 960 results, project data had:
- 99 ‘H’ flags for exceeding the holding time
- 70 ‘J’ flags for result values between the method detection limit and the lower reporting limit, meaning that the given results are estimated values
- 13 ‘J’ flags for matrix spike duplication failed high, indicating an estimated value with a high bias.
All field duplicate samples were within the specified relative percent difference of 25%, and there were no detections of nutrients in field blanks.
Some samples had issues with inconsistency between the site names and sampling times recorded on the sampling bottles, and the site names and sampling times recorded on the COC forms.
The BRPA, CFC, and DEQ discussed ways to improve data quality at their annual meeting. The need for a revised sample delivery process that will ensure that all samples reach the lab within the allowed holding time was also emphasized. The complex and confusing naming of the Station IDs (Table 1) was identified as a challenge to the accuracy and consistency of sample labeling and field record keeping, and the possibility of introducing simplified Station IDs was discussed.
Nutrient Standards
In 2025, the Montana Legislature passed HB 664, repealing Montana’s base numeric nutrient standards and leaving the general prohibitions in ARM 17.30.637 as the default narrative standard. ARM 17.30.637 (1) prohibits substances that will, among other things (d) create concentrations or combinations of materials which are toxic or harmful to human, animal, plant, or aquatic life; and (e) create conditions which produce undesirable aquatic life. Where waterbody-specific standards are not present, these prohibitions provide the foundation for the interpretation of nutrient pollution and algae levels.
Although no numeric standards currently exist for algal growth in the Bitterroot River, standards developed for the Clark Fork River as part of the Voluntary Nutrient Reduction Program (Tri-State Implementation Council 1998) may be useful to provide context for interpretation of chlorophyll-a results and are included here for that purpose:
- (Summer mean) – Benthic 100 mg/square meter algal chlorophyll a
- (Maximum) – Benthic 150 mg/square meter algal chlorophyll a
Streamflow Conditions
Streamflow conditions during spring runoff and summer months influence nutrient concentrations and algal densities. Years with less-than-average peak flows and early summer low flows typically see higher algal densities, and conversely, years with higher peak flows tend to produce less algal density. Figure 2 shows annual hydrographs for 2025 (including quantiles of the range historical flow data across the period of record at each site) for three USGS streamflow monitoring stations along the Bitterroot River, arranged upstream to downstream, to provide context for interpreting nutrient and algae results (USGS, 2026). In general, streamflow conditions in the Bitterroot River during 2025 were characterized by an early peak flow at near median levels, and an early recession to summer baseflow. Baseflow conditions were about normal in the upper river (Bitterroot River near Darby) for most of August and September, although there were periods of below normal baseflows in July and October. Except for a few transient spikes in flow, baseflow conditions were below normal during the summer and fall for the middle and lower Bitterroot River (Figure 2).

Total Phosphorus
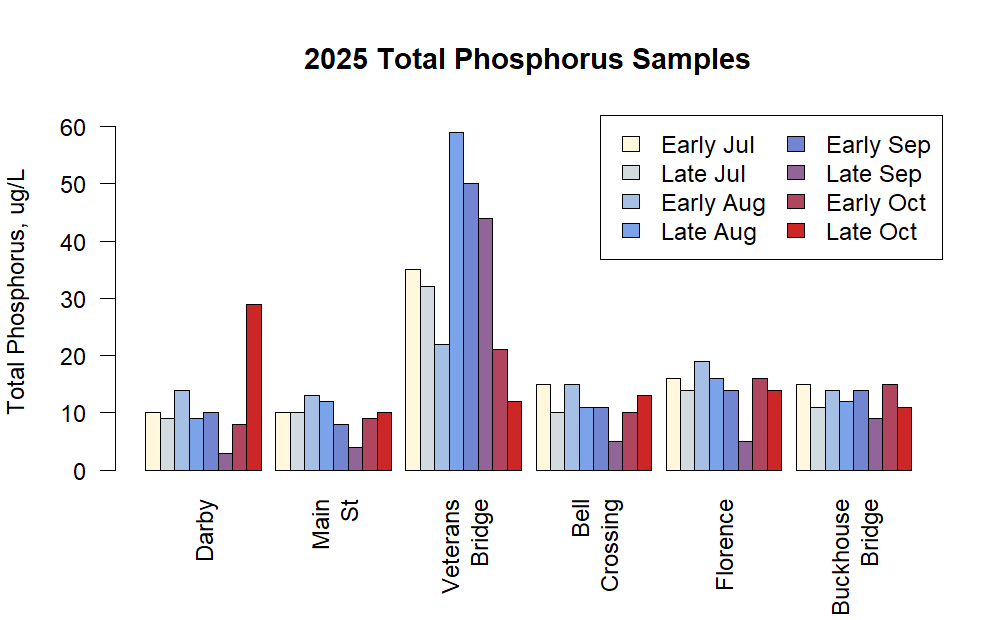
Results of Total Phosphorus (TP) monitoring are presented in Figure 3. TP concentrations were generally moderate and averaged around 10 ug/L across all sites except for Veterans Bridge. The uppermost site, Darby, showed the highest level of variability in measured TP, with a single high measurement of 29 ug/L during late October representing a nearly 10-fold increase over the lowest level of 3 ug/L measured in late September. The high value measured at this site during late October was from a sample that exceeded its holding time limit, therefore this value should be treated with some caution. TP levels at Veterans Bridge were generally much higher than TP levels at other sites, although the late October sample at Veterans Bridge falls within the range observed at the other sites. The sharp increase in TP from Main St to Veterans Bridge occurs across a short distance (about 2.5 miles) and likely indicates P loading from the Hamilton wastewater treatment plant and other sources associated with the Hamilton urban and suburban area. Across all sites, there is no clear seasonal trend in TP levels. All TP samples were above the detection limit of 1 ug/L.
Soluble Reactive Phosphorus
While Total Phosphorus includes some forms that are readily available for biological uptake and forms that are more difficult for plants or algae to use, Soluble Reactive Phosphorous (SRP) is readily available to plants and algae. Results of Soluble Reactive Phosphorus (SRP) monitoring are presented in Figure 4. SRP levels were very low at all sites except for Veterans Bridge, and 18 of the 48 samples were below the detection limit of 1 ug/L. At Veterans Bridge, SRP levels were substantially higher than at the other sites, especially during late August and all of September when values approached 40 ug/L. As with the pattern of TP concentrations, the elevated levels of SRP at Veterans Bridge likely indicate a municipal source. Early and late July samples at Bell Crossing were somewhat higher than other samples at this site, possibly indicating greater transport and less uptake of SRP between Veterans Bridge and Bell Crossing during these times.

Total Nitrogen
Results of Total Nitrogen (TN) monitoring are presented in Figure 5. TN levels are moderate across the Bitterroot River and show a general increase in a downstream direction, although Bell Crossing breaks this pattern with lower TN concentrations than the surrounding sites. Many sites showed decreasing TN through the September and October sampling periods, although the degree of temporal variation in TN at each site was moderate. All TN samples were above the detection limit of 20 ug/L.

Nitrate + Nitrite
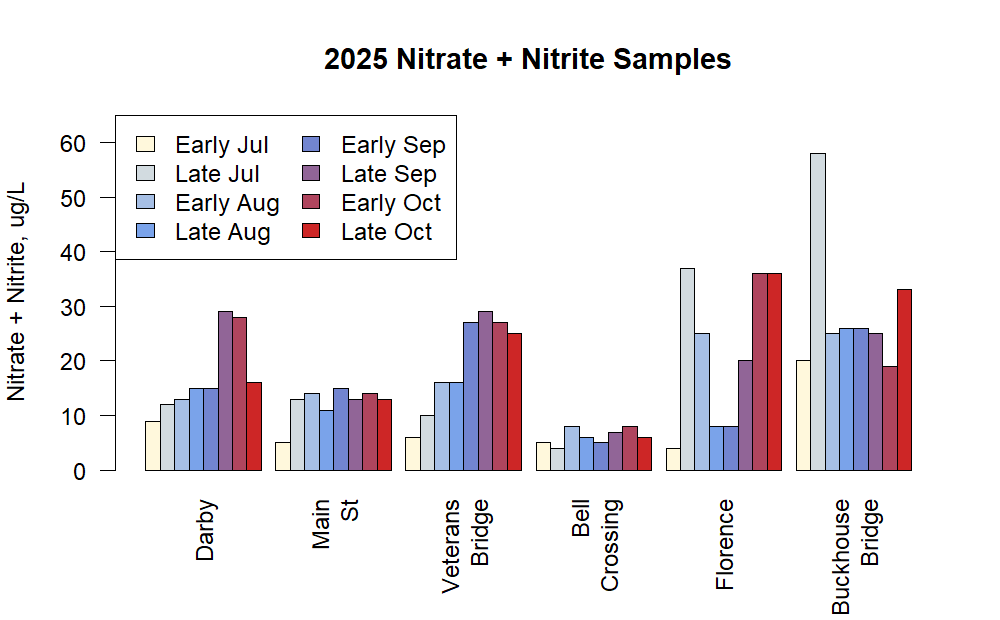
Results of Nitrate + Nitrite (N+N) monitoring are presented in Figure 6. N+N levels follow approximately the same pattern as TN levels, although there is more variability in N+N levels within and between sites. N+N levels are substantially lower at Bell Crossing than at other sites, and N+N levels generally increased from early July to the later samplings at all sites. The lowest two sites, Florence and Buckhouse Bridge, showed high variability in N+N levels, with a maximum value observed for the late July sampling at both sites. High N+N concentrations can fuel quick algae growth, but algal uptake can also quickly lower N+N levels. To explore these dynamics, the percentage of TN that is in the form of N+N is presented in Figure 7. N+N makes up a maximum of 32% of TN at Buckhouse Bridge during late July, a sample that had high levels of both TN and N+N. At Bell Crossing, N+N makes up less than 10% of total N across all samples. Early July samples showed a lower percentage of N+N than nearly all later samples at all sites, possibly indicating rapid biological uptake of N+N during this period.

Ammonia
Ammonia is a preferred source of nitrogen for algae and bacteria, so it is generally short-lived in aquatic systems. Ammonia is produced by decomposition of organic material in the river and can also be loaded into the river from external pollution sources such as wastewater treatment plants. Results from Ammonia monitoring are presented in Figure 8. 30 of the 48 Ammonia samples were below the detection limit of 6 or 7 ug/L. There is no clear spatial or temporal pattern of Ammonia concentrations, although the highest measured concentration of 50 ug/L occurred at Bell Crossing in late July, a site with moderate TN levels and low N+N levels.

Nitrogen : Phosphorus Ratios
Since the observation of Redfield (1934 and 1958) that marine phytoplankton contains a molecular C:N:P ratio of 106:16:1 (40:7:1 by mass), the relative concentrations of N and P have been used to estimate which of these nutrients might be limiting, preventing additional primary production (algae growth) in aquatic ecosystems. Redfield also recognized that the ratio is an average with considerable variation by species, season, and environment. A departure from this ratio is assumed to imply nutrient deficiency such that by identifying which nutrient is responsible for enhanced algae growth, management actions can be directed toward the nutrient with the highest impact.
It is important to note that the C:N:P ratios in the above literature for benthic algae are for the internal contents of the algal matrix (cellular C:N:P concentration), not water column concentrations. The C:N:P of the benthic algal material is a much better estimator of nutrient limitation than water column TN:TP ratio. This is especially true for benthic algae; while water column total nutrients can be good estimators of optimal stoichiometry for phytoplankton (where suspended algal biomass is a large fraction of the total nutrients in the water column) benthic algae are more loosely coupled with the water column and respond only to bioavailable nutrients (from Kyle Flynn, MDEQ, personal communication).
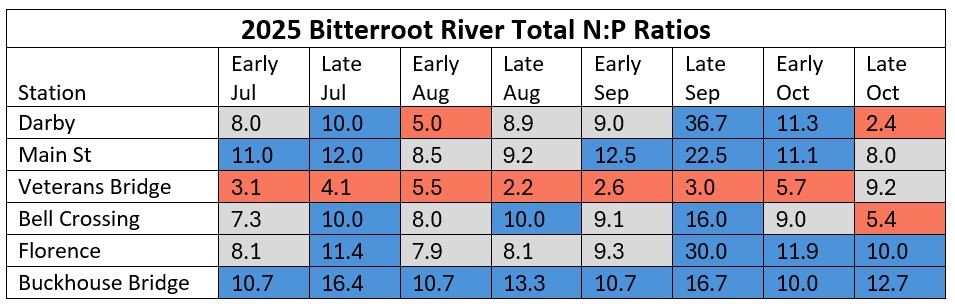
Total N:P ratios (by mass) were calculated for 2025 results and are shown below in Table 2. The N:P Redfield ratio (by mass) is 7:1, and the color-coded thresholds in Table 3 are based on the following from Suplee and Watson (2013): “Studies of benthic algae show that it is necessary to move some distance above or below the Redfield ratio in order to be strongly convinced that a lotic waterbody is P or N limited (Dodds, 2003). When a benthic algal Redfield ratio (by mass) is <6, N limitation is suggested, and when it is >10 P limitation is indicated (Hillebrand and Sommer, 1999). Thus, there is a range of N:P values between about 6 and 10 where one can state, for practical purposes, that algal growth is co-limited by N and P.”
We also include ratios of Nitrate + Nitrite : Soluble Reactive Phosphorus (also by mass) in Table 3 with caveats: the Redfield ratio is based on total N:P, but soluble and available forms of N and P such as N+N and SRP may better reflect nutrient limitation if total concentrations are dominated by other (e.g., organic) forms of N and P which are not easily available for uptake by benthic algae. In this dataset, N+N is measured from unfiltered samples while SRP is measured from field-filtered samples, as both N+N and SRP are soluble and available, the ratio still signifies the state of nutrient limitation. The N+N:SRP ratios do not provide a definitive signal of nutrient limitation status and are simply presented for comparison. Total N:P ratios provide strong indications of N limitation at Veterans Bridge for all but the last sampling event, and P limitation at Buckhouse Bridge across all sampling events. The apparent N limitation at Veterans Bridge is associated with the large increase in TP at this site, and the P limitation at Buckhouse Bridge is associated with a slight increase in TN and a slight decrease in TP compared to the upstream sites (Figure 3). All other sites show indications of P limitation during some sampling events and no clear indication of N or P limitation during other sampling events, with a weak suggestion of a shift towards N limitation during the late October sampling event.
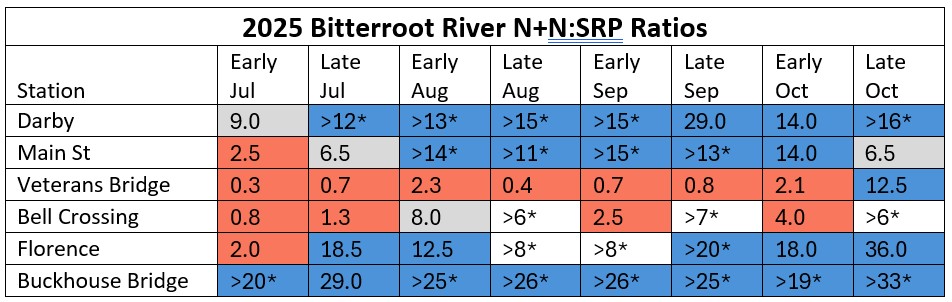
N+N:SRP ratios suggest generally similar patterns of N and P limitation as the total N:P ratios, with results for Veterans Bridge indicating N limitation for all but the last sampling event and results for Buckhouse Bridge indicating P limitation across all sampling events. Results for all but the upstream and downstream-most sites (Darby and Buckhouse Bridge) indicate N limitation during the early July sampling, consistent with the higher N+N levels (and percents) at these two sites during early July as compared to the middle four sites. N+N:SRP ratios also indicate N limitation at Bell Crossing during some sampling periods and suggest that the high P levels and resulting N limitation at the upstream Veterans Bridge site can lead to a depletion of the available N+N at Bell Crossing (Figure 6).
Benthic Algae
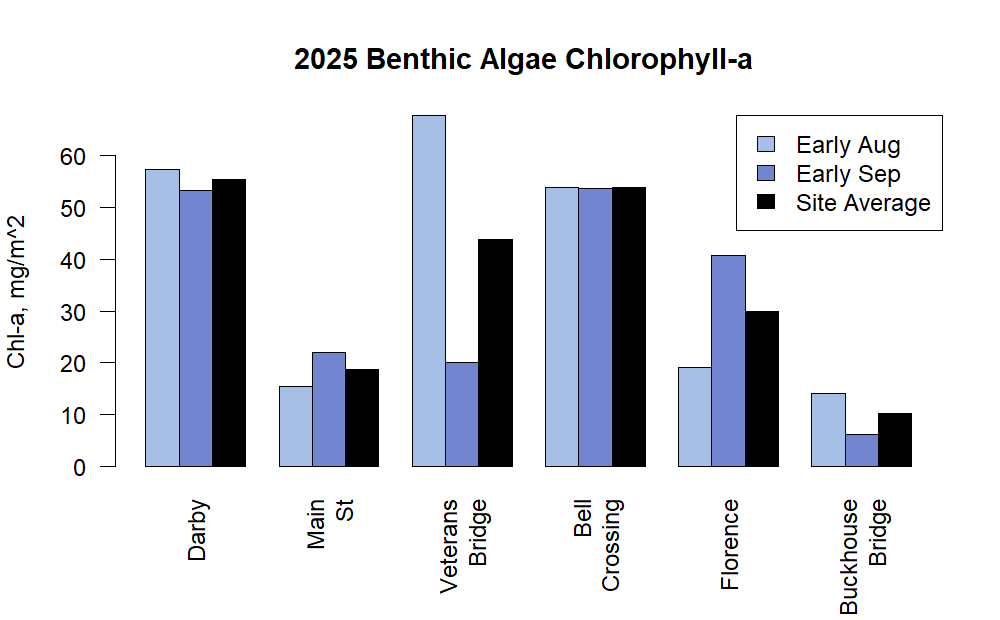
Benthic algae (algae attached to the streambed) were sampled during early August and early September at all six sites in accordance with the SAP. Chlorophyll-a results for each sampling and averages for each site (Figure 9) do not show a consistent pattern across space or time, although chlorophyll-a values at Darby and Bell Crossing were consistently high. Veterans Bridge showed very high variability in chlorophyll-a, with the highest measured value of any site of 67.8 mg/m2 for the early August sampling but a much lower value of 20 mg/m2 for the early September sampling. Florence also showed substantial variability in chlorophyll-a levels, with the early September value of 41 mg/m2 doubling the early August value of 19 mg/m2. Both Main St and Buckhouse Bridge showed consistently low chlorophyll-a levels. All individual samples and site averages were well below the maximum and average targets for algae on the adjacent Clark Fork River, suggesting that sampled algae levels in the Bitterroot River in 2025 do not indicate excessive growth or undesirable conditions.

Benthic Ash Free Dry Weight (AFDW) results show a very similar pattern as chlorophyll-a results, with consistently higher levels at Darby and Bell Crossing, high levels for the early August sampling at Veterans Bridge and the early September sampling at Florence, and consistently low levels at Main St and Buckhouse Bridge.
With only two sampling events, it is difficult to evaluate temporal trends in benthic algae chlorophyll-a or AFDW. There is no consistent indication of an increase or decrease from the early August to early September sampling events. It is possible that algae growth could have peaked before the early August sampling due to early hydrograph recession in 2025 (Figure 2), as was observed in the Clark Fork River in 2025. Additional sampling earlier in the year might better characterize peak algae conditions but would also add substantial cost to this project. Looking forward, project partners could consider ways to integrate less labor-intensive methods for long-term monitoring algal growth into this project.
Nutrient Availability and Algal Growth
Although the levels of algal chlorophyll-a and AFDW measured in 2025 remain low compared to levels observed in highly eutrophic systems, nutrient availability is a clear driver of algal growth across all sites except for the uppermost site, Darby. At Darby, concentrations of total and available forms of nutrients are low or moderate relative to concentrations observed at other sites, yet both early August and early September samples showed relatively high levels of algal chlorophyll-a and AFDW. The very low SRP concentrations at this site (Figure 4) may indicate the depletion of SRP due to rapid biological uptake associated with algal growth, emphasizing that measured nutrient concentrations are both a cause and an effect of algal growth. Thus, although the N+N:SRP ratios suggest that algal growth is limited by available SRP, this limitation does not necessarily imply that algal growth will be limited at a low level.
Downstream from Darby, low algae levels at Main St correlate with low levels of TP and SRP, and low to moderate levels of TN and N+N. Any P limitation is quickly relieved a short distance downstream at Veterans Bridge, sharp increases in levels of TP and SRP (Figures 3 and 4) indicate loading from the Hamilton area and drive increased algal growth, especially during the early August sampling. The effects of this additional P extend downstream to Bell Crossing, where the observed high algae levels are associated with a decline in TP, SRP, TN, and N+N concentrations, suggesting rapid biological uptake. The increased P at Veterans Bridge and Bell Crossing leads to indications of N limitation at these sites (Tables 2 and 3), but the increased algal growth associated with this limitation indicates that the N limited conditions are caused by an increase in P availability rather than a decrease in N availability.
Algal levels generally decline in a downstream direction through Florence and Buckhouse Bridge, although the early September sample at Florence remains high. Declining TP and SRP levels along with increasing TN and N+N levels across these two sites indicate the gradual attenuation of the Hamilton P source, the possible contributions of additional N sources, and a resulting shift towards P limitation.
The relationship between measured nutrient concentrations and algal growth across the whole river is complex. Measured nutrient concentrations do not include the portion of nutrients that are incorporated into biomass (other than any suspended biota captured in the samples), and the uptake of large amounts of nutrients into biotic form (e.g., due to excessive algal growth) can mask the correlations between nutrients and algae. Low concentrations of the apparent limiting nutrient(s) therefore result from an unknown combination of biotic nutrient uptake, nutrient cycling, and nutrient inputs (or dilution) from tributaries and groundwater. Further, other factors including sunlight, water temperature, availability of other nutrients, channel geometry, riverbed composition, and scour may accelerate or constrain algal growth, so N and/or P limitation may not always explain algal growth patterns.
The complex patterns of apparent nutrient limitation across space and time reveal the challenges of treating single nutrient limitation as a comprehensive foundation for understanding algal growth and managing nutrient loads. For example, even if the Veterans Bridge site is fully N limited and additional P has no effect on algal growth, the additional P will be carried downstream and will likely stimulate increased algal growth at the Florence and Buckhouse Bridge sites. Further, nutrients that are physically or biologically retained may become available to stimulate algal growth at a later date. Thus, single nutrient limitation is a helpful concept for interpreting the relationships between nutrient levels and algal response at a specific location and time, but whole-summer and whole-river algal growth is influenced by both N and P availability. Despite the complexity of aquatic nutrient cycling, nutrient loading is a clear driver of nutrient limitation and algal growth, and measured nutrient concentrations provide a critical indication of nutrient limitation status and the potential for excessive algal growth. Ongoing monitoring of nutrient concentrations and algal growth and ongoing management of nutrient loads is necessary to understand the status of the Bitterroot River and prevent degradation from excessive nutrient pollution. The generally low and moderate nutrient concentrations and algae levels observed during the 2025 season are a positive sign for the Bitterroot River, but the effects of P loads associated with the Hamilton wastewater treatment plant and other sources associated with the Hamilton area persist for miles downstream and warrant careful attention.
References
Dodds, W.K., 2003. Misuse of Inorganic N and Soluble Reactive P Concentrations to Indicate Nutrient
Status of Surface Waters. Journal of the North American Benthological Society. 22(2): 171-181.
Hillebrand, H. and U. Sommer. 1999. The Nutrient Stoichiometry of Benthic Microalgal Growth: Redfield Proportions Are Optimal. Limnology and Oceanography. 44: 440-446.
Montana Department of Environmental Quality. 2019a. Draft Nonpoint Source Program 20-Year Vision and Strategic Plan. Helena, MT.
Montana Department of Environmental Quality. 2019b. Bitterroot Watershed Focus Area Project Plan. Helena, MT.
Montana Department of Environmental Quality, 2025. Bitterroot Mainstem Long-term Nutrient Trends Monitoring – Sampling and Analysis Plan (SAP).
Montana Department of Environmental Quality, 2026. QA/QC Report for 2025 Bitterroot Mainstem Long-term Nutrient Trends Monitoring, QAPP ID: BRMMASQAPP-19, Water Quality Planning Bureau, March.
Redfield A.C., 1934. On the proportions of organic derivatives in sea water and their relation to the composition of plankton. Liverpool University Press, Liverpool, p. 176–192
Redfield A.C., 1958. The biological control of chemical factors in the environment. Am Sci 46:205–221.
Suplee, M.W., and V. Watson, 2013. Scientific and Technical Basis of the Numeric Nutrient Criteria for Montana’s Wadeable Streams and Rivers—Update 1. Helena, MT: Montana Dept. of Environmental Quality.
Tri-State Implementation Council. 1998. Clark Fork River: Voluntary Nutrient Reduction Program. Sandpoint, ID: Tri-State Implementation Council.
U. S. Geological Survey, 2026. Water Data for the Nation. Data downloaded May, 2026. https://waterdata.usgs.gov