Annual Water Quality & Benthic Algae Monitoring Results for the Clark Fork River Basin
Prepared by: Clark Fork Coalition, P.O. Box 7593, Missoula, MT 59807
Introduction
This page presents 2025 results for a long-term nutrient and benthic algae monitoring program on the Clark Fork River. This collaborative project was conducted by the Clark Fork Coalition (CFC) University of Montana (UM), Avista, and the Montana Department of Environmental Quality (DEQ) in 2025, with oversight from the Clark Fork River Water Quality Monitoring Committee (CFRWQMC).
Further analysis of annual results from this monitoring program is accomplished on a five-year schedule when the Clark Fork River Water Quality Monitoring Committee contracts a statistical evaluation and trends analysis. The latest trends report covered the period 2018-2022 (HydroSolutions, 2025) and the next trends report will be presented in 2028, adding data through 2027.
The current monitoring program is a continuation of the Montana portion of a program that was originally developed in 1998 by the Tri-State Water Quality Council (TSWQC). The TSWQC began a basin-wide targeted monitoring program in 1998, in part to assess the progress of a 10-year Voluntary Nutrient Reduction Program (VNRP) in Montana. Nutrient and algal targets developed for the VNRP were later adopted as numeric standards in the Clark Fork basin in 2002 – the first numeric standards for nutrients and algae in Montana.
This monitoring program supports two overall objectives:
- Control nuisance algae in the Clark Fork River by reducing nutrient concentrations;
- Protect Lake Pend Oreille water quality by maintaining or reducing current rates of nutrient loading from the Clark Fork River.
The objectives are met by:
- Monthly monitoring: Avista collects monthly nutrients and field constituents at the Clark Fork River below Cabinet Gorge Dam, (excluding December, January, and February). During the months of July, August, and September, monitoring is also conducted at sites below Thompson Falls and at Noxon Bridge.
- Peak flow monitoring: In addition to monthly monitoring, Avista collects nutrient samples at the Clark Fork River below Cabinet Gorge Dam during spring peak flow (six sampling events over a 1-month period in approximately May and/or June);
- Summer monitoring: The Clark Fork Coalition collects nutrient samples and field constituents in summer at nine Clark Fork River sites and one site on the Lower Flathead River (six sampling events, July-September);
- Benthic algae monitoring: CFC and UM collect summer benthic algae samples for chlorophyll-a and ash-free dry weight at seven Clark Fork River sites during two sampling events (August and September) and may collect additional samples in July at a subset of these sites to capture peak algal biomass.
Specifically, the CFRWQMC measures:
- Nutrients: total phosphorus as P (TP), soluble reactive phosphorus as P (SRP) from filtered samples, total persulfate nitrogen as N (TN), nitrate + nitrite nitrogen as N (N+N) from filtered samples, and ammonia as N from filtered samples.
- Field parameters: water temperature (˚C), dissolved oxygen (mg/L), pH (standard units), redox potential (mv), specific conductance (μs/cm), total dissolved solids (mg/L), total suspended solids (mg/L) and turbidity (NTU). Not all field parameters are collected at all sites.
- Benthic algae: chlorophyll-a (mg/m2) and ash-free dry weight (g/m2).
Monitoring Locations and Frequency
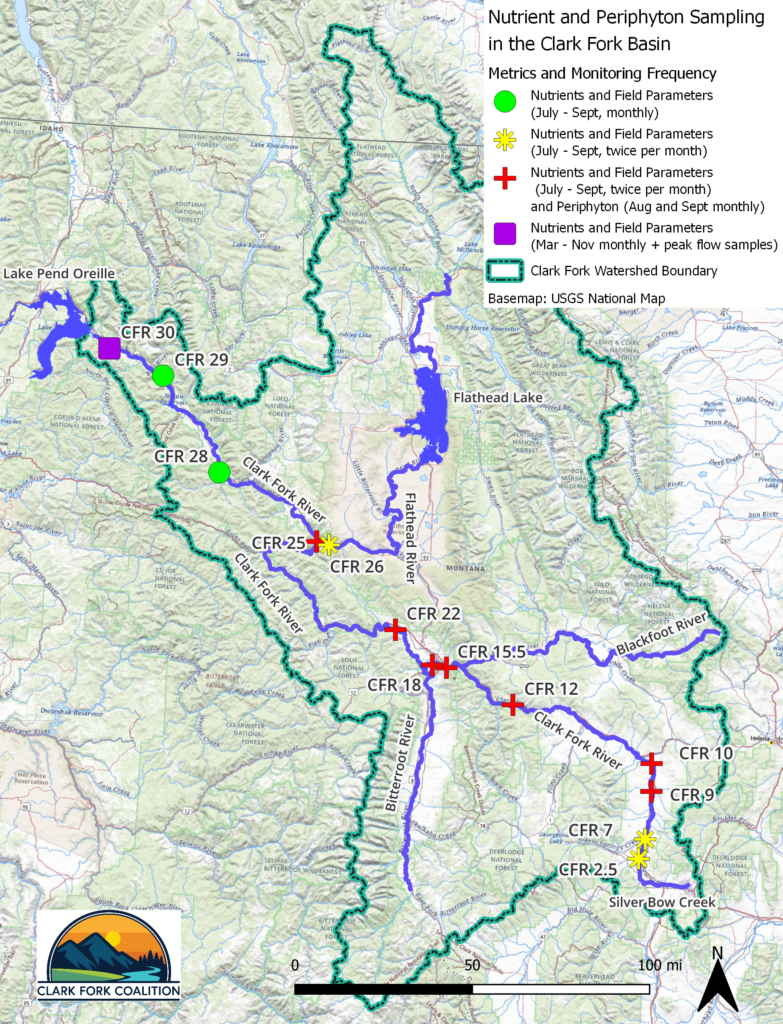
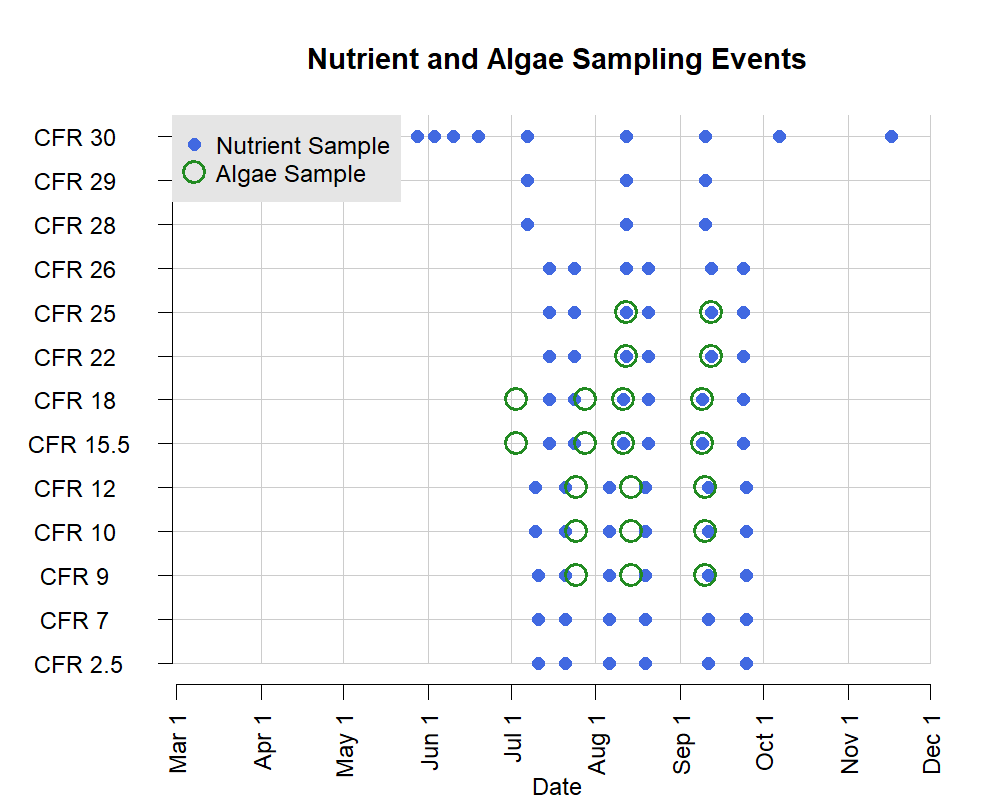
Monitoring locations are spread out across the Clark Fork Basin (Figure 1) and are intended to capture general trends in nutrient concentrations and algal growth along the mainstem river as well as the impact of nutrient loading from Missoula and other municipalities. Nutrients are measured at all monitoring stations during the growing season, although the frequency of sampling varies for different sites. Algae is measured at 7 sites along the mainstem Clark Fork River. Sampling frequencies for all sites are specified in Table 1 and Figure 2, and exact sampling dates can be seen in the full dataset.
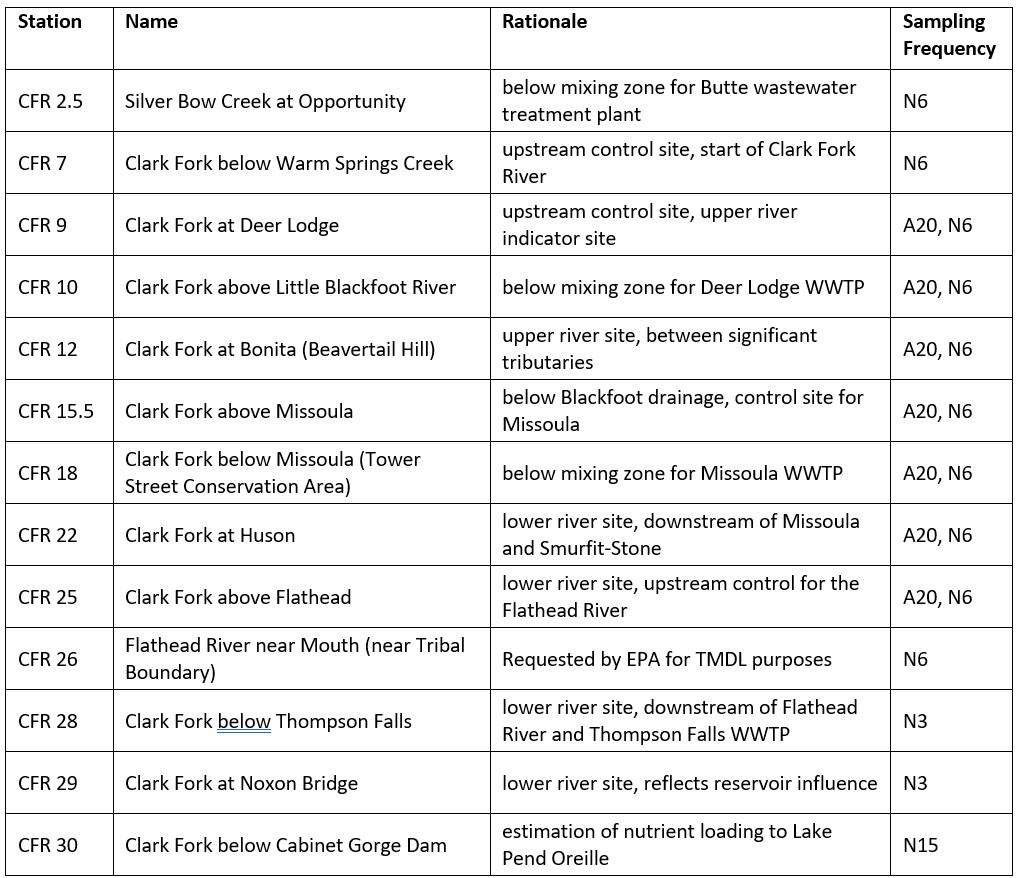
N6 = Twice Monthly monitoring for nutrients and field constituents (July, August, and September).
N3 =Monthly monitoring for nutrients and field constituents (July, August, and September).
N15 = Monthly monitoring for nutrients and field constituents, 9 monthly samples (March – November) and Peak flow monitoring for nutrients, 6 peak flow samples
A20 = Benthic algae monitoring for Chlorophyll-a and ash-free dry weight, 10-20 replicates per site, August and September. Due to early low-flow conditions and early algae growth, stations 9 through 18 were also monitored in July (as shown in Figure 2).
Data Availability and QA/QC Summary
All results are given as the concentration of N or P within the sample, not the concentration of the compound. For example, N+N results indicate the sum of NO3-N and NO2-N. Full results for this project including measured field parameters, sample duplicates, and blanks, are included as an attachment to this document and are also available through the federal Water Quality Portal at https://www.waterqualitydata.us/. Attachments and results are also available on the Clark Fork Coalition website at https://clarkfork.org/long-term-monitoring/.
Field science is messy, and it is necessary to have rigorous procedures in place to ensure data quality. All laboratory and field data were reviewed and validated per guidance in the SAP (MDEQ, 2025). Montana DEQ analyzes and flags the monitoring data each year for quality assurance/quality control and provides the QA/QC Report for 2025 Clark Fork River Monitoring. This section briefly summarizes the results.
All sites were sampled on schedule per the SAP and no project data were rejected due to sampling or handling problems. Project completeness was 100%.
Of the 1784 total results from the project, the data had:
- Zero results B flagged for field blank contamination
- Twenty seven results H flagged for exceeding the holding time
- Thirty five results J flagged for result value between the MDL and LRL
- One result J flagged for MS/MSD failed high (expect high bias)
- Seven results J flagged for MS/MSD failed low (expect high bias)
The CFWQMC discussed ways to improve data quality at their annual meeting and emphasized ways to speed up sample delivery and meet sample holding times.
Nutrient and Algae Targets
In 2025, the Montana Legislature passed HB 664, repealing Montana’s base numeric nutrient standards and leaving the general prohibitions in ARM 17.30.637 as the default narrative standard. ARM 17.30.637 (1) prohibits substances that will, among other things (d) create concentrations or combinations of materials which are toxic or harmful to human, animal, plant, or aquatic life; and (e) create conditions which produce undesirable aquatic life. Where waterbody-specific standards are not present, these prohibitions provide the foundation for the interpretation of nutrient pollution and algae levels. However, numeric algal chlorophyll and nutrient standards from ARM 17.30.631 (2002) remain in effect for two sections of the Clark Fork River.
From the Upper Clark Fork River from the Warm Springs Creek confluence (N46º11’17”, W112º46’03”) to the confluence with the Blackfoot River (N46º52’19”, W113º53’35”), ARM 17.30.631 (2002) provides the following numeric water quality targets for Total Nitrogen, Total Phosphorus, and benthic algal chlorophyll a, applicable from June 21 to September 21:
- Total Phosphorus as P: 20 μg/L
- Total Nitrogen as N: 300 μg/L
- (Summer mean) – Benthic 100 mg/square meter algal chlorophyll a
- (Maximum) – Benthic 150 mg/square meter algal chlorophyll a
This section of the Clark Fork River includes monitoring stations CFR 7 through CFR 12.
For the Middle Clark Fork River from the confluence with the Blackfoot River (N46º52’19”, W113º53’35”) to the confluence with the Flathead River (N47º21’45”, W114º46’43”), ARM 17.30.631 (2002) provides numeric water quality standards for Total Nitrogen, Total Phosphorus, and benthic algal chlorophyll a, applicable from June 21 to September 21 as follows:
- Total Phosphorus as P: 39 μg/L
- Total Nitrogen as N: 300 μg/L
- (Summer mean) – Benthic 100 mg/square meter algal chlorophyll a
- (Maximum) – Benthic 150 mg/square meter algal chlorophyll a
This section of the Clark Fork River includes monitoring stations CFR 15.5 through CFR 25.
The mainstem Clark Fork River below the confluence with the Flathead River is not covered by ARM 17.30.631 (2002), but guidance for nutrient and algae levels are provided by the Clark Fork River Voluntary Nutrient Reduction Program (VNRP) (Tri-State Implementation Council 1998). The VNRP extends the same standards for the Clark Fork River from the Blackfoot to the Flathead as targets for the Lower Clark Fork River from below the confluence with the Flathead to Lake Pend Oreille.
Streamflow Conditions
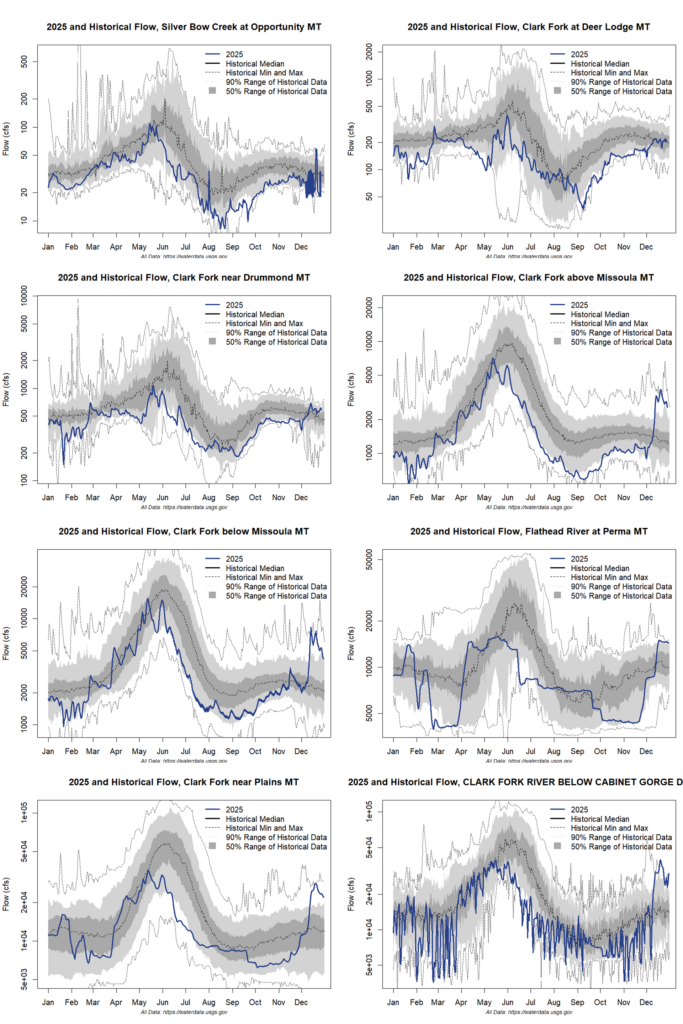
Streamflow conditions during spring runoff and summer months influence nutrient concentrations and algal densities. Years with lower-than-average peak flows and early summer low flows typically see higher algal densities, and conversely, years with higher peak flows tend to produce less algal density. Figure 3 shows annual hydrographs for 2025 (including quantiles of the range historical flow data across the period of record at each site) from eight stations in the study area, arranged upstream to downstream, to provide context for interpreting nutrient and algae results (USGS, 2026). In general, streamflow conditions in 2025 were characterized by early peak flow, and early recession to a lower than usual baseflow (Figure 3). Baseflow at the Silver Bow Creek, Deer Lodge, and Above Missoula sites was at or near the record low during periods of August and September. Although baseflow conditions were not as extreme for the lower river, the hydrograph peak and recession were extremely early at the Plains site, leading to unseasonably low flows in June and July. Baseflow at all sites remained well below typical levels through September and into November. Discharge at the Flathead River near Perma and at the Clark Fork River below Cabinet Gorge are highly influenced by the operation of the Seli’š Ksanka Qlispe’ Dam (formerly the Kerr dam) and Cabinet Gorge Dam, respectively, and flows at both locations dropped to baseflow levels unusually early but then maintained typical baseflow levels during most of August and September.
Total Phosphorus
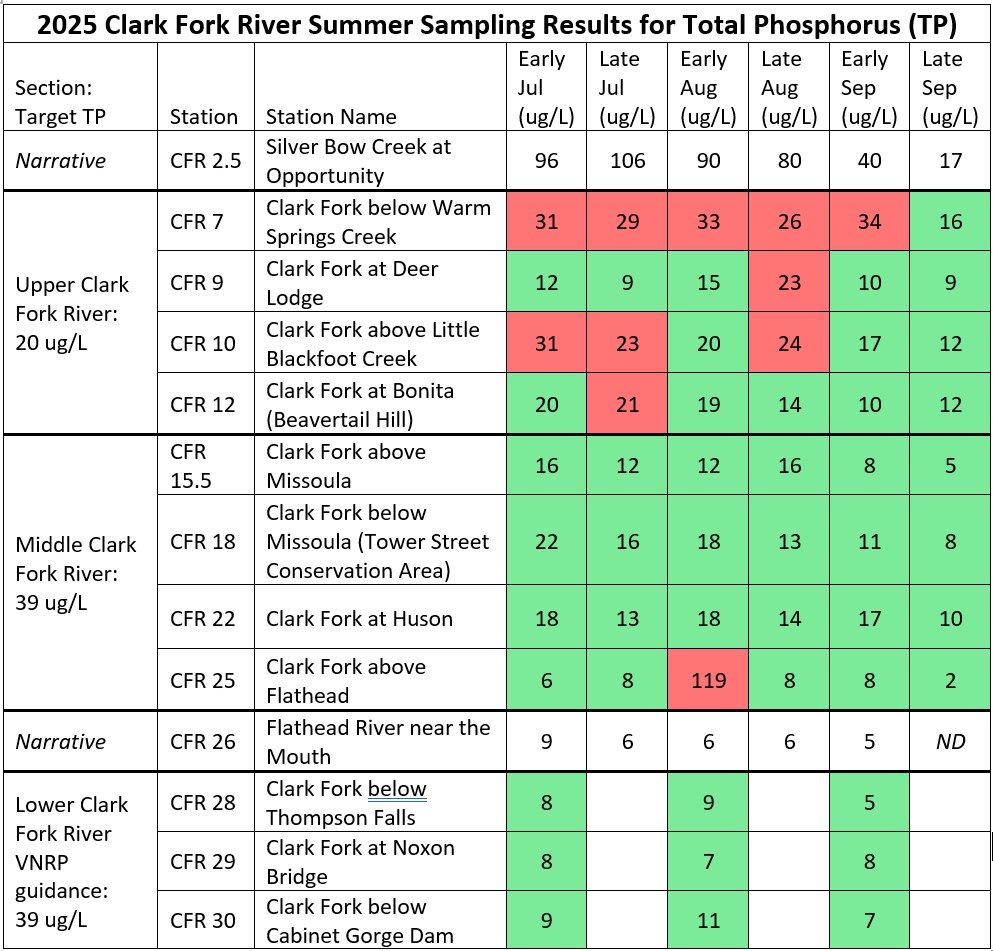
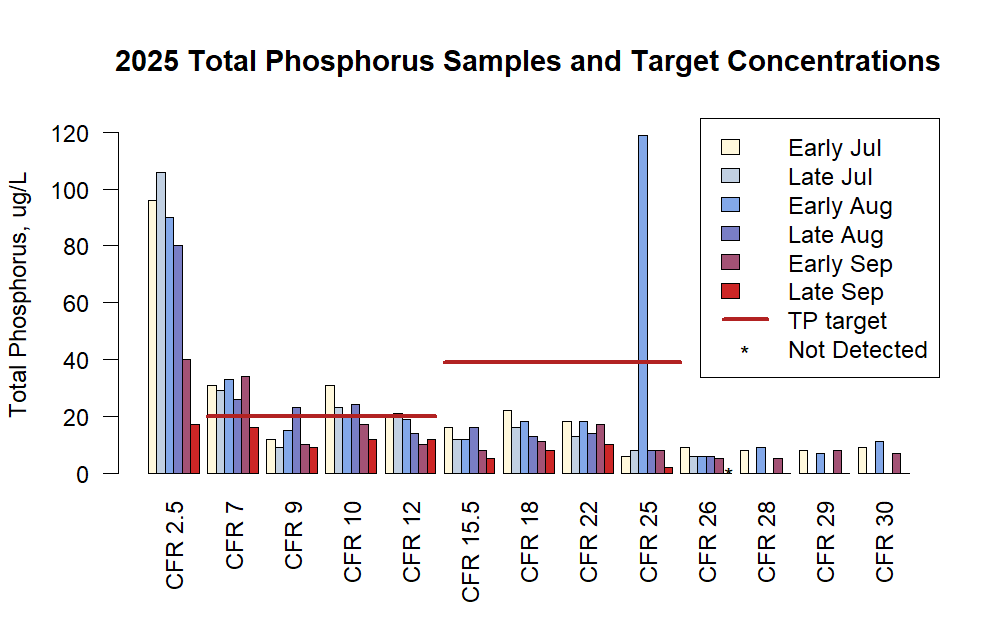
The Narrative standard applicable to Silver Bow Creek at Opportunity and the Flathead River near the Mouth does not provide a numeric target for Total Phosphorus (TP). Concentrations of TP in Silver Bow Creek were consistently higher than concentrations at the downstream Clark Fork below Warm Springs Creek site in the Clark Fork River, although this difference was greatest for the July and August samples and became less pronounced for the September samples. TP concentrations in the Flathead River were generally similar to or slightly lower than concentrations at the adjacent Clark Fork above Flathead site in the Clark Fork River. All TP results are summarized in Table 2 and Figure 4.
For the Upper Clark Fork section, TP concentrations exceeded the 20 ug/L target (ARM 17.30.631) for 10 of the 24 samples. High concentrations were observed from early July through early September, with a maximum value of 33 ug/L observed at the uppermost site (Clark Fork below Warm Springs Creek) in early August. This uppermost site exceeded the target for five of the six sampling events, more than any other site. The Clark Fork above Little Blackfoot Creek site exceeded the target for three of the six sampling events. All Upper Clark Fork sites met the target during the late September sampling event.
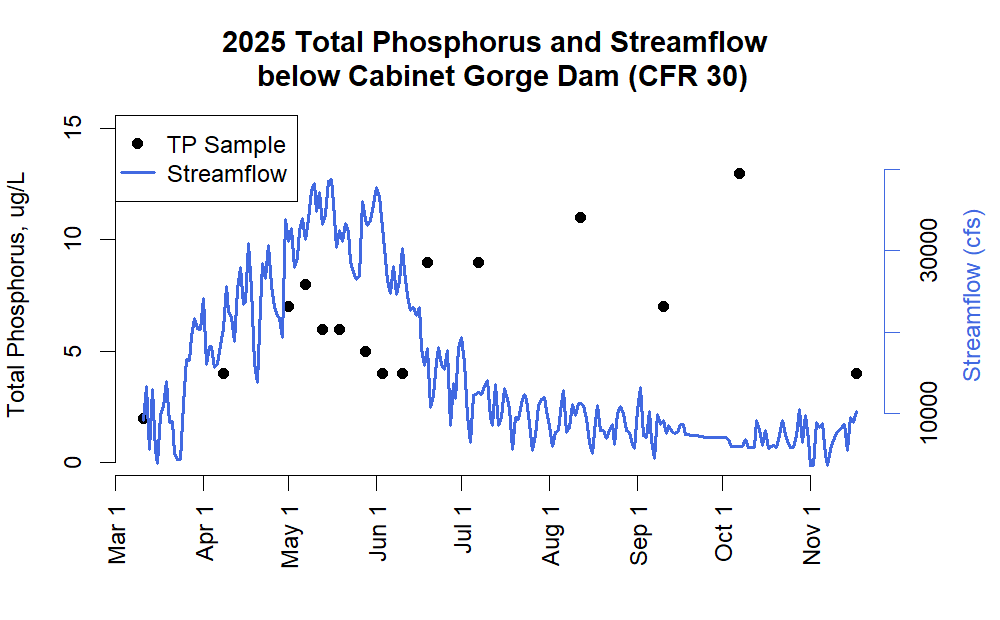
The TP target increases to 39 µg/L for the Middle Clark Fork below the Little Blackfoot and above the confluence with the Flathead River (ARM 17.30.631). TP concentrations were well below the target on all occasions at all monitoring stations in this section except for a single high value of 119 ug/L for the Clark Fork above Flathead site during the early August sampling event. Although this value is almost five times higher than the next largest TP concentration observed in this reach, there are no QA/QC flags associated with this sample that indicate a known quality issue. Nonetheless, this extremely high value may represent a fluke and is unlikely to signify general water quality conditions. TP concentrations in the Lower Clark Fork remain well below the voluntary target of 39 ug/L established in the VNRP (Tri-State Implementation Council 1998). Samples taken at the lowest site (Clark Fork below Cabinet Gorge Dam) span a longer timeframe than other sites, and do not show a clear relationship with streamflow measured at the nearby USGS gauge (CLARK FORK RIVER BELOW CABINET GORGE DAM ID, USGS-12391950) (Figure 5).
Soluble Reactive Phosphorus
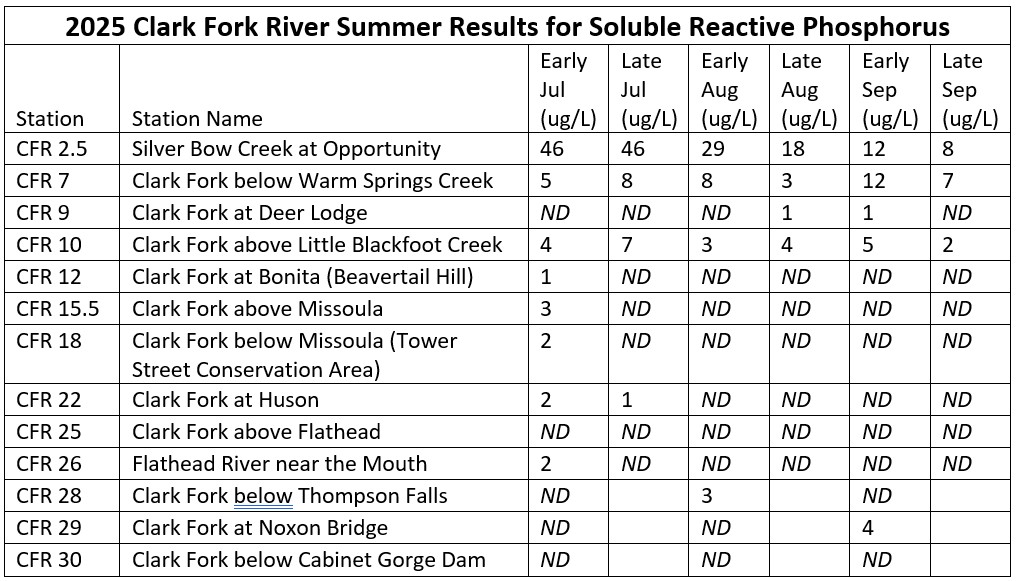
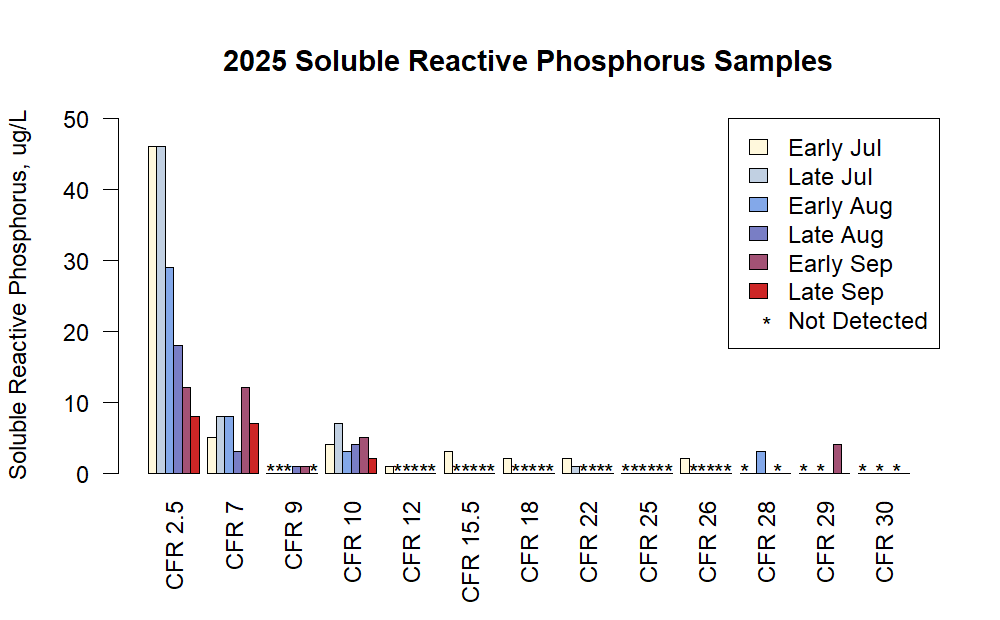
While Total Phosphorus includes some forms that are readily available for biological uptake and forms that are more difficult for plants or algae to use, Soluble Reactive Phosphorous (SRP) is readily available to plants and algae. SRP concentrations were noticeably higher in Silver Bow Creek than elsewhere in the monitoring network, declining from a high of 46 µg/L in July to a low of 8 µg/L in late September. The Clark Fork below Warm Springs Creek and Clark Fork above Little Blackfoot Creek sites showed moderate concentrations, but no clear trends across the summer sampling events. SRP concentrations at all other sites were very low, with most samples falling below the detection limit of 1 ug/L. All samples taken at the lowest site, Clark Fork below Cabinet Gorge Dam, were below the detection limit. SRP results are summarized in Table 3 and Figure 6.
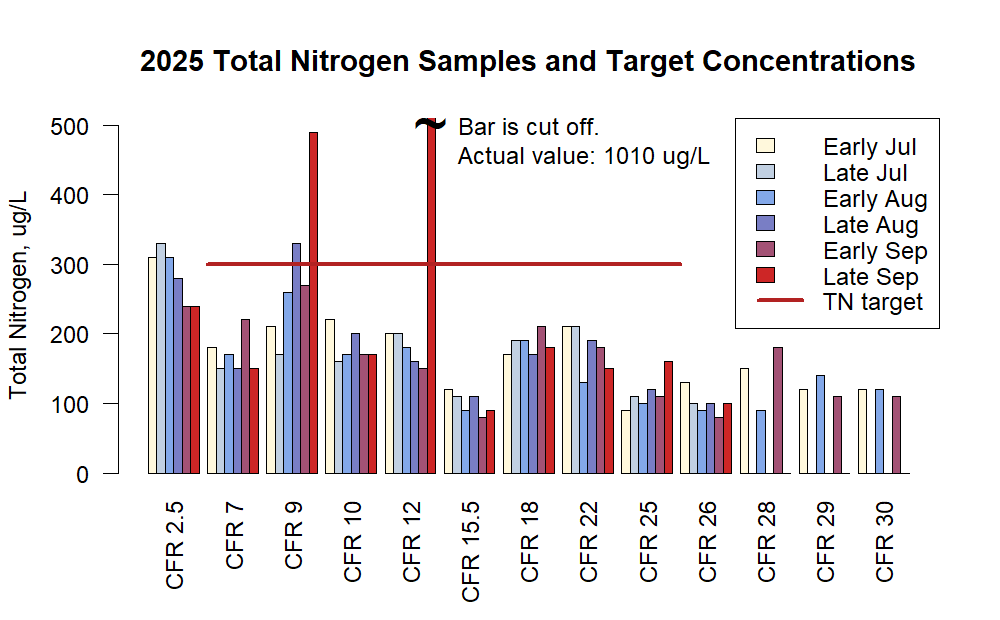
Total Nitrogen
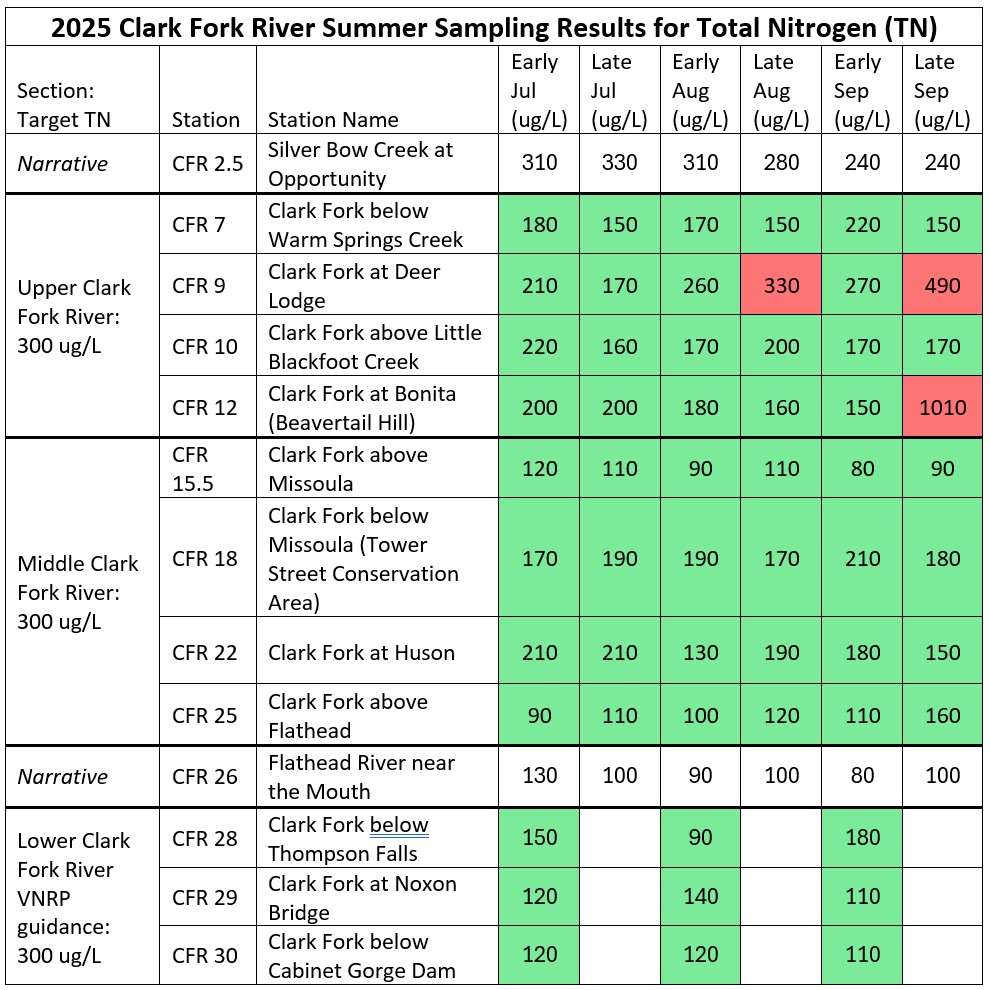
Results of total nitrogen (TN) monitoring are presented in Table 4 and Figures 7-8. All samples were above the detection limit of 2 ug/L.
The Narrative standard applicable to Silver Bow Creek at Opportunity and the Flathead River near the Mouth does not provide a numeric target for TN. Concentrations of TN in Silver Bow Creek were consistently higher than concentrations at the downstream Clark Fork below Warm Springs Creek site in the Clark Fork River. TN concentrations in the Flathead River were generally similar to concentrations at the adjacent Clark Fork above Flathead site in the Clark Fork River.
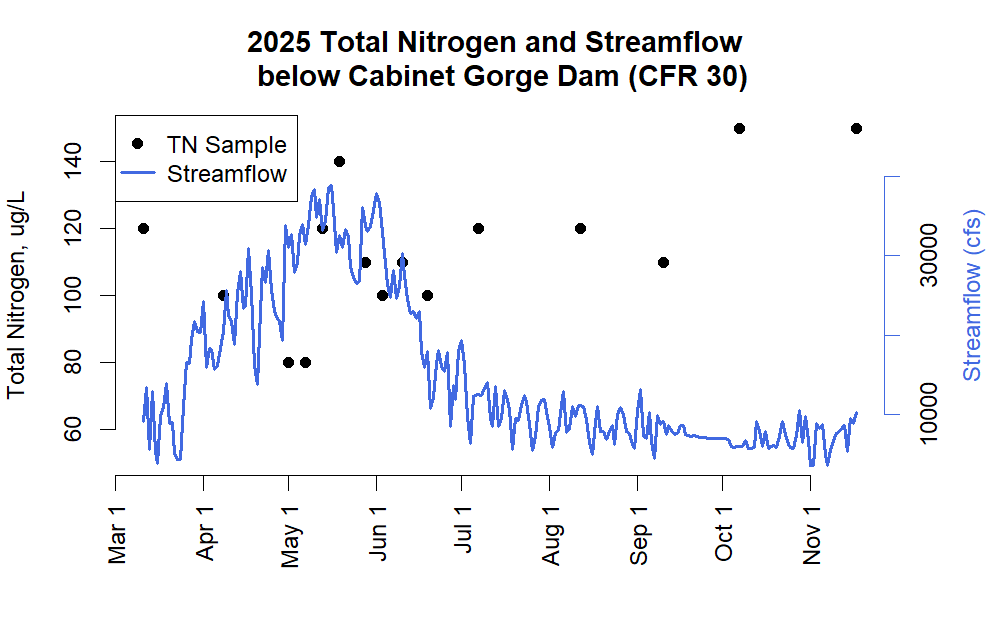
For the Upper Clark Fork section, TN concentrations exceeded the 300 ug/L target (ARM 17.30.631) for 3 of the 24 samples. High concentrations were observed during the later parts of the sampling period, with a maximum value of 1010 ug/L observed at the Clark Fork at Bonita site in late September. Although this value was much higher than all other observed values, there are no QA/QC flags associated with this sample that indicate a known quality control issue. The other exceedances were recorded for the late August and late September sampling events at the Clark Fork at Deer Lodge site. All Middle Clark Fork results were below the 300 ug/L target (ARM 17.30.631), and all Lower Clark Fork results were below the 300 ug/L guidance from the VNRP (Tri-State Implementation Council 1998). Samples taken at the lowest site (Clark Fork below Cabinet Gorge Dam) span a longer timeframe than other sites, and do not show a clear relationship with streamflow measured at the nearby USGS gauge (CLARK FORK RIVER BELOW CABINET GORGE DAM ID, USGS-12391950) (Figure 5).
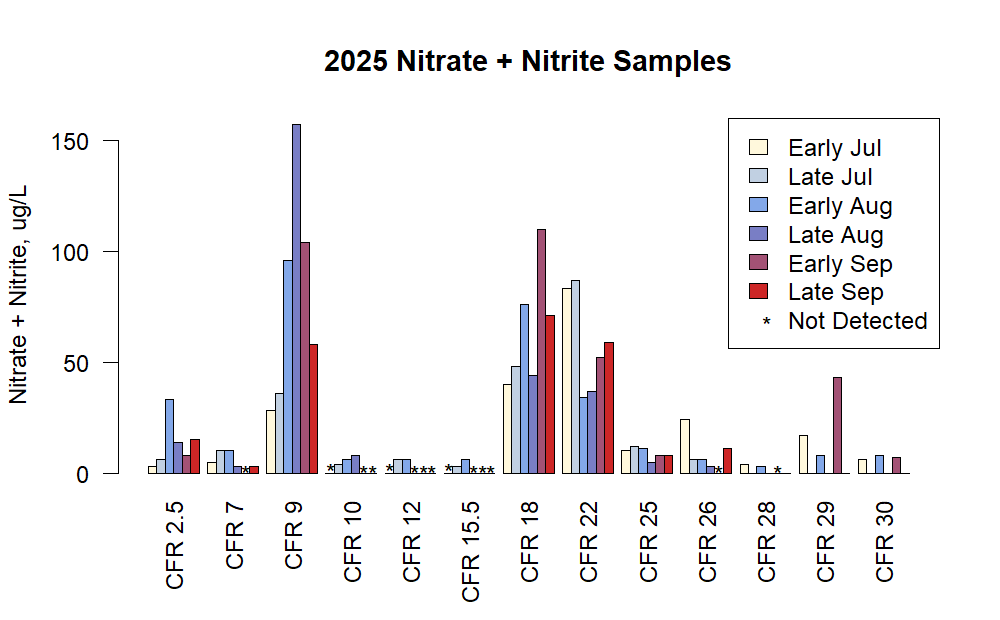
Nitrate + Nitrite
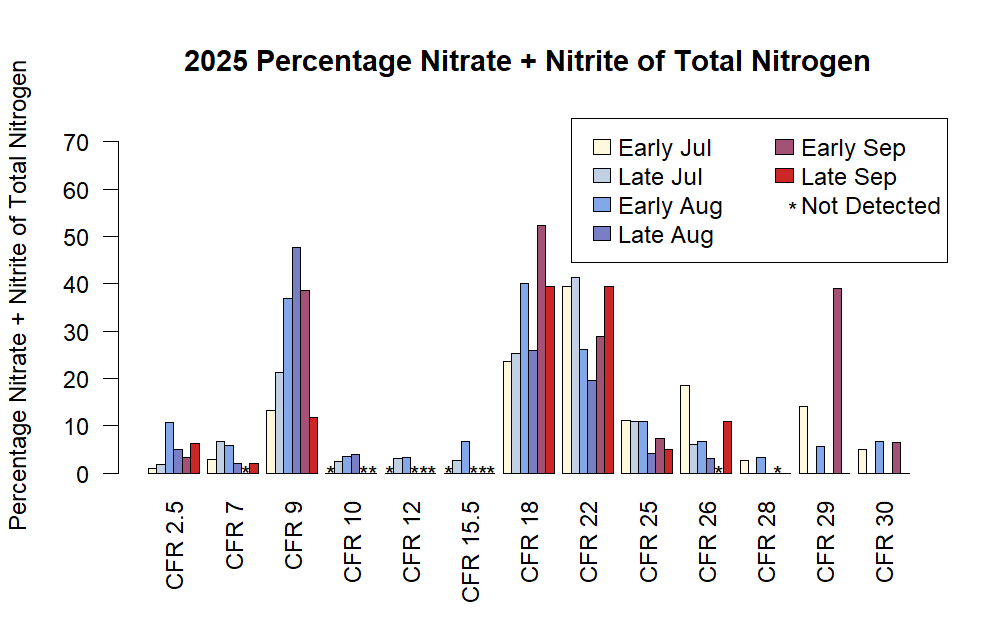
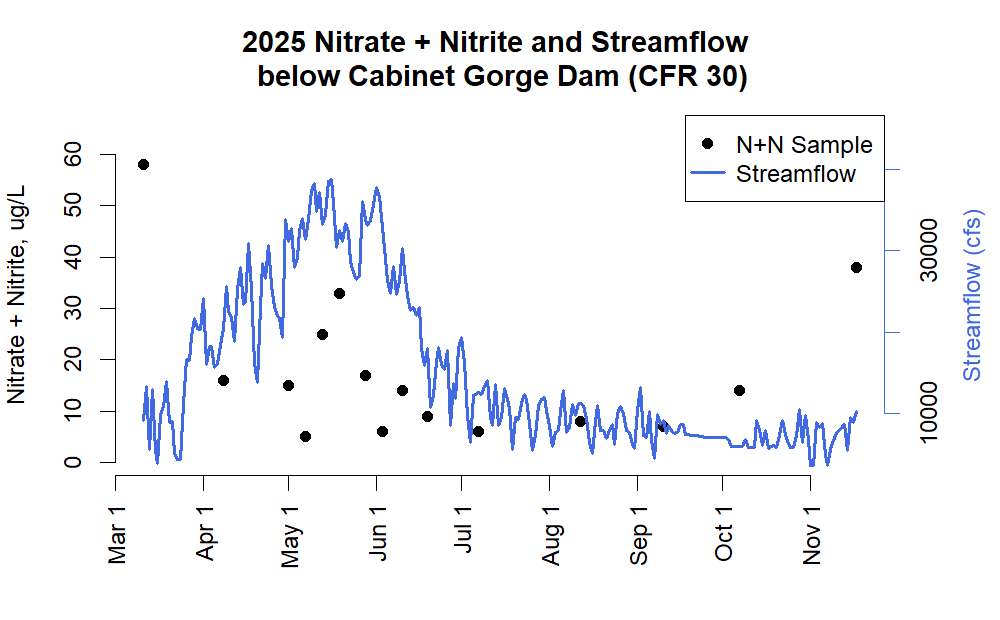
Results of Nitrate + Nitrite (N+N) monitoring are presented in Table 5 and Figures 9-11. There is no numeric target for nitrate + nitrite. Concentrations of N+N were highest for the Clark Fork at Deer Lodge, Clark Fork below Missoula, and Clark Fork at Huson sites. N+N levels were notably low for all sites between Deer Lodge and Missoula, and for the Clark Fork below the Flathead. High N+N concentrations can fuel quick algae growth, but algal uptake can also quickly lower N+N levels. To explore these dynamics, the percentage of TN that is in the form of N+N is presented in Figure 10. Most sites show a single-digit percentage of N+N, although the sites with high N+N concentrations show higher percentages as well. Samples taken at the lowest site (Clark Fork below Cabinet Gorge Dam) span a longer timeframe than other sites, and the relationship between N+N concentrations and streamflow at the nearby USGS gauge (CLARK FORK RIVER BELOW CABINET GORGE DAM ID, USGS-12391950) shows variable concentrations during runoff, low concentrations during summer baseflow, and high concentrations during winter baseflow (Figure 11).

Nitrogen : Phosphorus Ratios
Since the observation of Redfield (1934 and 1958) that marine phytoplankton contains a molecular C:N:P ratio of 106:16:1 (40:7:1 by mass), the relative concentrations of N and P have been used to estimate which of these nutrients might be limiting, preventing additional primary production (algae growth) in aquatic ecosystems. Redfield also recognized that the ratio is an average with considerable variation by species, season, and environment. A departure from this ratio is assumed to imply nutrient deficiency such that by identifying which nutrient is responsible for enhanced algae growth, management actions can be directed toward the nutrient with the highest impact.
It is important to note that the C:N:P ratios in the above literature for benthic algae are for the internal contents of the algal matrix (cellular C:N:P concentration), not water column concentrations. The C:N:P of the benthic algal material is a much better estimator of nutrient limitation than water column TN:TP ratio. This is especially true for benthic algae; while water column total nutrients can be good estimators of optimal stoichiometry for phytoplankton (where suspended algal biomass is a large fraction of the total nutrients in the water column) benthic algae are more loosely coupled with the water column and respond only to bioavailable nutrients (from Kyle Flynn, MDEQ, personal communication).
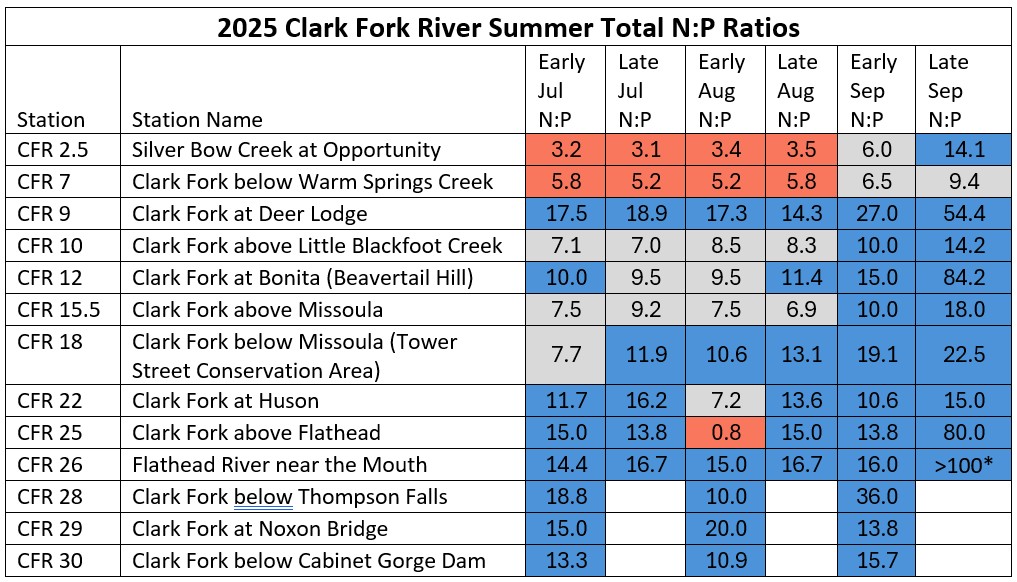
Total N:P ratios (by mass) were calculated for 2025 results and are shown below in Table 7. The N:P Redfield ratio (by mass) is 7:1, and the color-coded thresholds in Table 3 are based on the following from Suplee and Watson (2013): “Studies of benthic algae show that it is necessary to move some distance above or below the Redfield ratio in order to be strongly convinced that a lotic waterbody is P or N limited (Dodds, 2003). When a benthic algal Redfield ratio (by mass) is <6, N limitation is suggested, and when it is >10 P limitation is indicated (Hillebrand and Sommer, 1999). Thus, there is a range of N:P values between about 6 and 10 where one can state, for practical purposes, that algal growth is co-limited by N and P.”
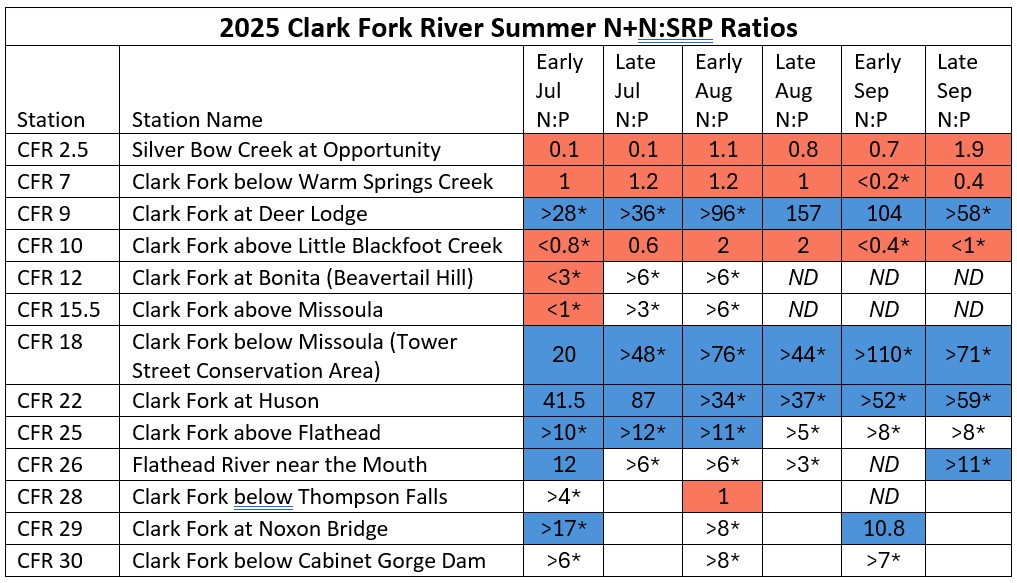
We also include ratios for the dissolved fractions of Nitrate + Nitrite : Soluble Reactive Phosphorus (also by mass) in Table 8 with caveats: the Redfield ratio is based on total N:P, but dissolved and available forms of N and P such as N+N and SRP may better reflect nutrient limitation if total concentrations are dominated by particulates (including organic or sediment particles and terrestrial material) or other forms of N and P which are not easily available for uptake by benthic algae. The N+N:SRP ratios do not provide a definitive signal of nutrient limitation status and are simply presented for comparison.
Total N:P ratios indicate N limitation for all July and August samples at the Silver Bow Creek and Clark Fork below Warm Springs Creek sites, and P limitation for most sites on the lower river except for the early August sample for the Clark Fork Above Flathead where an anomalously high TP concentration was measured (Section 6.1, Figure 4). From above Little Blackfoot Creek to Missoula, results do not clearly indicate N or P limitation during July and August, but indicate P limitation for September samples. N+N:SRP ratios suggest strong and consistent N limitation at the Silver Bow Creek, Clark Fork below Warm Springs Creek, and Clark Fork above Little Blackfoot Creek sites, but this pattern in the upper river is broken by the suggested P limitation for the Clark Fork at Deer Lodge. As with the Total N:P ratios, the lower river appears to be mostly P limited, although the prevalence of samples below the detection limit makes it difficult to fully assess the spatial or temporal changes.
Benthic Algae Results
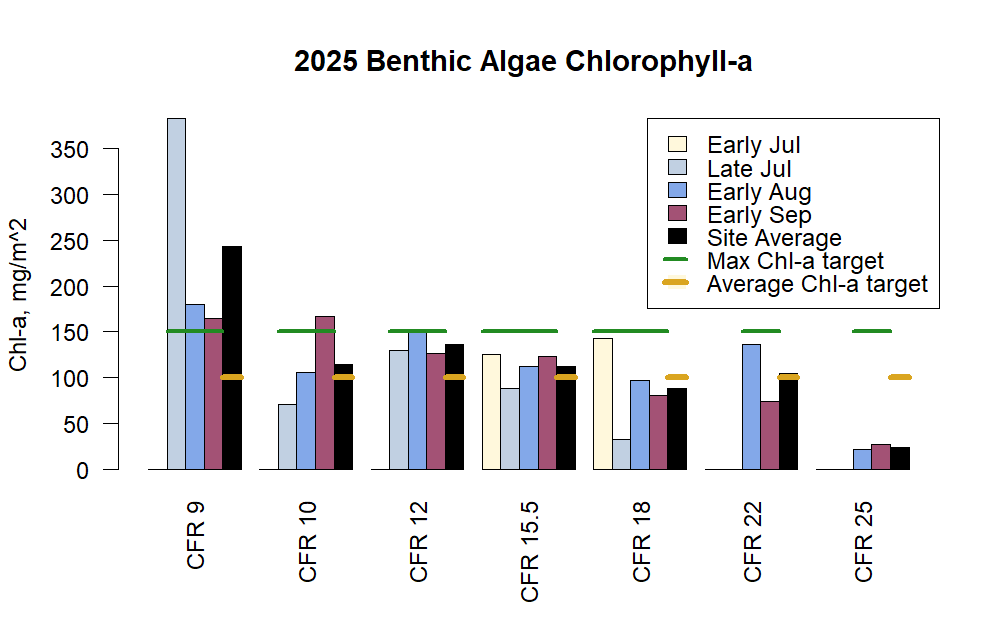
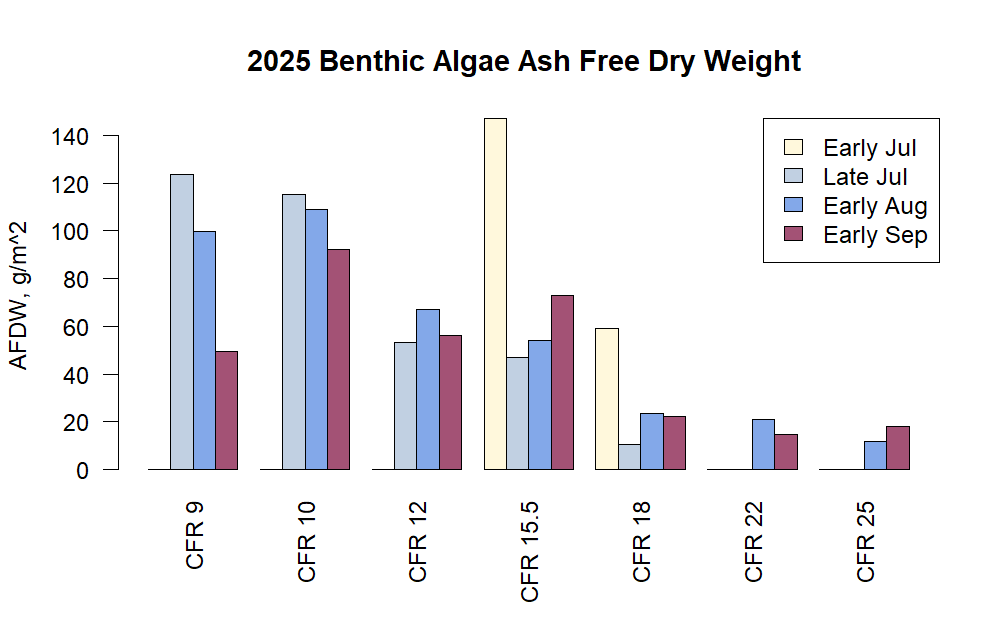
Benthic algae were sampled during August and September at seven sites in accordance with the SAP, with additional samples taken earlier in the year at some sites to capture early peak algae growth (Figure 2). Chlorophyll-a levels exceed the maximum target level of 150 mg/m2 for all samples at the uppermost site (Clark Fork at Deer Lodge, CFR 9) and for one sample at the next downstream site (Clark Fork above Little Blackfoot Creek, CFR 10) (Figure 14). Chlorophyll-a levels exceed the average target level of 100 mg/m2 for 5 of the 7 sites, with average chlorophyll-a level generally declining in a downstream direction. There is no standard for algal Ash Free Dry Weight (AFDW). AFDW results also showed a general decline in a downstream direction, an early peak at most sites, and a general decline from earlier samplings to later samplings (Figure 15). The additional samples taken in early July at the Clark Fork above Missoula and Clark Fork below Missoula sites (CFR 15.5 and CFR 18) captured the highest levels of chlorophyll-a and AFDW observed at those sites, and the late July samples also showed very high levels of chlorophyll-a and AFDW at many sites. Although algae blooms in the Clark Fork River are typically thought to peak later in the year, these results indicate very early peak algae growth. This early sampling was conducted in response to observations of high levels of algae growth as early as June, and concerns that only sampling in August and September (the minimum requirement in the SAP) would fail to adequately characterize peak algae conditions. Indeed, the results presented here would look very different and would fail to substantiate observations of early and significant algae growth if the July samples had not been collected.
The early algae peak in 2025 is consistent with the early hydrograph recession (Figure 3) and warm water temperatures experienced in 2025. This phenological shift highlights the difficulty of scheduling sampling events based on calendar time, when algal growth is influenced by hydrologic conditions that vary in timing from year to year. Algal chlorophyll-a and AFDW sampling and analysis is labor intensive, and a comprehensive sampling regime applying these methods from June through September at all sites would add substantial cost and difficulty to this project. Future sampling efforts will benefit from collecting additional samples in July or earlier in response to observations of early algal growth, yet this opportunistic sampling may create data quality concerns and challenge the comparability of results from different years. Looking forward, project partners should continue to examine this challenge and consider ways to integrate less labor-intensive methods for long-term monitoring of algal growth into this project.
Nutrient Availability and Algal Growth
The highest levels of chlorophyll-a for 2025 were observed at the Clark Fork River at Deer Lodge (CFR 9), which had high levels of TN and N+N, but moderate levels of TP and very low levels of SRP. With the abundance of N at this site, algae may grow and take up P until the available P (represented by SRP) becomes scarce, thus creating a situation of P limitation. The steep decline in both TP and SRP in a downstream direction from the Silver Bow Creek site (CFR 2.5) through the Deer Lodge site (CFR 9) provides a further indication of algal uptake of SRP across this section of river, although the exact connection between algae growth and SRP depletion is obscured by other factors including the mineralization or decomposition of other forms of P into SRP and the contribution or dilution of P and SRP by tributaries and groundwater. Despite this uncertainty, the high algae levels and the very low SRP levels at the Clark Fork River at Deer Lodge provide a clear indication of P limitation (Table 7 and 8).
Algae levels decrease downstream of Deer Lodge, although chlorophyll-a is near or above the target level for average concentrations though the Clark Fork at Huson site (CFR 22). Within this section of river, N+N and SRP levels suggest N limitation at the Clark Fork above Little Blackfoot (CFR 10), possible co-limitation by N and P at the Clark Fork at Bonita (CFR 12) and Clark Fork above Missoula (CFR 15.5), and P limitation at the Clark Fork below Missoula (CFR 18) and Clark Fork at Huson (CFR 22). The final algae site, Clark Fork above Flathead (CFR 25) shows much lower chlorophyll-a levels and appears to be co-limited by N and P.
Elevated levels of TN, TP and chlorophyll-a in upstream sites demonstrate the connection between nutrient loading and excessive algal growth, but the relationship between measured nutrient concentrations and algal growth across the whole river is complex. Measured nutrient concentrations do not include the portion of nutrients that are incorporated into biomass (other than any suspended biota captured in the samples), and the uptake of large amounts of nutrients into biotic form (e.g., due to excessive algal growth) can mask the correlations between nutrients and algae. Low concentrations of the apparent limiting nutrient(s) therefore result from an unknown combination of biotic nutrient uptake, nutrient cycling, and nutrient inputs (or dilution) from tributaries and groundwater. Further, other factors including sunlight, water temperature, availability of other nutrients, riverbed composition, and scour may accelerate or constrain growth, so N or P limitation may not always explain algal growth patterns.
The complex patterns of apparent nutrient limitation across space and time reveal the challenges of treating single nutrient limitation as a comprehensive foundation for understanding algal growth and regulating nutrients. For example, even if the Deer Lodge site is fully P limited and additional N has no effect on algal growth, the additional N will be carried downstream and will likely stimulate increased algal growth in other areas of the river. Further, nutrients that are physically or biologically retained may become available to stimulate algal growth at a later date. Thus, single nutrient limitation is a helpful concept for interpreting the relationships between nutrient levels and algal response at a specific location and time, but whole-summer and whole-river algal growth is influenced by both N and P availability.
Despite the complexity of aquatic nutrient cycling, nutrient loading is a clear driver of nutrient limitation and algal growth, and measured nutrient concentrations provide a critical indication of nutrient limitation status and the potential for excessive algal growth. Ongoing monitoring of nutrient concentrations and algal growth and ongoing management of nutrient loads is necessary to understand the status of the Clark Fork River and prevent degradation from excessive nutrient pollution. The high concentrations of TN and TP observed in 2025 are driven by nutrient loads as well as the early hydrograph recession and low baseflows (which lead to less dilution of nutrient loads), and the combination of high nutrient concentrations and low flows clearly drive the excessive (and early) algal growth observed at many sites along the Clark Fork River. The 2025 season therefore demonstrates the ongoing need to meet target TN and TP concentration targets in order to avoid excessive algal growth, and the challenge of meeting these targets during unusually dry years.
Peak Flow Nutrient Monitoring and Loading to Lake Pend Oreille
Peak flow nutrient monitoring is done below the Cabinet Gorge Dam to estimate nutrient loading from the Clark Fork watershed in Montana to Lake Pend Oreille in Idaho per the Montana and Idaho Border Nutrient Load Memorandum of Agreement (Border Agreement), established in 2002. Nutrient targets established in the Border Agreement were developed to maintain water quality in the open waters of Lake Pend Oreille from the mouth of the Clark Fork River to the Long Bridge (Highway 95). Nutrient targets are outlined in section VII of the Border Agreement as follows:
- An area-weighted euphotic-zone average concentration of 7.3 μg/L (TP) for Lake Pend Oreille,
- Total loading to Lake Pend Oreille of 328,651 kilograms per year (kg/year) TP,
- 259,500 kg/year TP from Montana (as measured at Clark Fork River below Cabinet Gorge Dam),
- 69,151 kg/year TP from Lake Pend Oreille watershed in Idaho,
- Greater than 15:1 TN:TP ratio, by mass.
The Border Agreement establishes short-term and long-term exceedances of the established nutrient targets. As stated in the Border Agreement, an exceedance of the target exists when either of the following conditions is documented:
- A short-term exceedance of the targets (three consecutive years of TP load increases at the border that are above the targets by greater than 10%).
- A long-term exceedance of the targets (a ten-year average TP concentration in the lake greater than 7.3 μg/L).
Every year the estimated annual TP load is evaluated against the Border Agreement’s nutrient load target for the Clark Fork River of 259,500 kg/year, and for short-term exceedance of this target. As of May 2026, Avista and Hydrosolutions are developing the latest report on nutrient loading to evaluate compliance with these requirements. This report will be attached when a final version is available.
References
Dodds, W.K., 2003. Misuse of Inorganic N and Soluble Reactive P Concentrations to Indicate Nutrient Status of Surface Waters. Journal of the North American Benthological Society. 22(2): 171-181.
Hillebrand, H. and U. Sommer. 1999. The Nutrient Stoichiometry of Benthic Microalgal Growth: Redfield Proportions Are Optimal. Limnology and Oceanography. 44: 440-446.
HydroSolutions, 2025. Clark Fork River Water Quality Trends Report 1998–2022. Helena, MT. Prepared for Montana Department of Environmental Quality, Helena, MT and Avista, Noxon, MT
Montana Department of Environmental Quality, 2025. Clark Fork River Water Quality Monitoring Program – Upper and Middle Clark Fork Sampling and Analysis Plan (SAP), June 2025.
Montana Department of Environmental Quality, 2026. QA/QC Report for 2025 Clark Fork River Monitoring, Water Quality Planning Bureau, February.
Redfield A.C., 1934. On the proportions of organic derivatives in sea water and their relation to the composition of plankton. Liverpool University Press, Liverpool, p. 176–192
Redfield A.C., 1958. The biological control of chemical factors in the environment. Am Sci 46:205–221.
Suplee, M.W., Watson, V., Dodds, W., and C. Shirley, 2012. Response of algal biomass to large scale nutrient controls in the Clark Fork River, Montana, USA. Journal of American Water Resources Association 48:1008-1021.
Suplee, M.W., and V. Watson, 2013. Scientific and Technical Basis of the Numeric Nutrient Criteria for Montana’s Wadeable Streams and Rivers—Update 1. Helena, MT: Montana Dept. of Environmental Quality.
Tri-State Implementation Council. 1998. Clark Fork River: Voluntary Nutrient Reduction Program. Sandpoint, ID: Tri-State Implementation Council.
U.S. Environmental Protection Agency, 1993. Clark Fork-Pend Oreille Basin Water Quality Study: A Summary of Findings and a Management Plan, EPA Region 10, Seattle, EPA 910/R-93-0 U. S. Geological Survey, 2026. Water Data for the Nation. Data downloaded May, 2026. https://waterdata.usgs.gov